

MSc | Altcoin Analyst • AI • RWA | Seeing what the market hasn’t priced in yet
Onchain
Joined May 2021
- Tweets89.9K
- Following997
- Followers45.7K
- Likes118K




Pinned Tweet
Most $TAO holders are flying blind.
They bought the token.
They watched the price.
They read the threads.
But they have never opened the one tool that shows them everything happening inside the Bittensor network in real time.
It is called Taostats.
It is free.
And after reading this, you will never look at $TAO the same way again.
Here is exactly how to use it.
Step 1: Start at the Subnets page.
This is the heartbeat of the entire network. Every subnet running on Bittensor is listed here with:
- its current emission rate
- the number of active miners and validators
- real-time performance data
The emission rate is the most important number on this page. It tells you exactly how much TAO is flowing into each subnet every block.
High emission means the network is directing significant resources toward that subnet's commodity. Low emission means the market has not yet recognised its value, or the subnet has not yet proven itself.
Watch which subnets are gaining emission share over time. That movement tells you where the network believes the most valuable work is being done, before any headline announces it.
Step 2: Use the Subnet pages to go deeper.
Click any subnet, and you enter a complete dashboard for that individual market.
- The TradingView chart shows you the alpha token price history for that subnet. Alpha tokens are the subnet-specific tokens that sit inside TAO's broader economy. Their price relative to TAO tells you how the market is valuing that subnet's specific commodity.
- The Metagraph is the full list of every miner and validator currently active in the subnet: their UID, their stake, their trust score, their emission share. This is the raw intelligence layer. The miners consistently earning the most emissions are producing the work the validators collectively agree is the most valuable.
- The Sentiment Index gives you a real-time community temperature reading on each subnet. Not price sentiment. Ecosystem sentiment. Whether the participants building inside the subnet believe it is healthy and improving.
Step 3: Check Validators before you stake anything.
This is the step most people skip and regret.
The Validators page on Taostats shows you the performance history of every validator on the network: their VTrust score, their emission consistency, and their weight-setting behaviour across subnets.
VTrust is the metric that matters most. It measures how closely a validator's judgments align with the honest stake-weighted majority across the network. High VTrust means the validator is doing genuine work and being rewarded for it. Low VTrust means the validator is either lazy, copying other validators' weights, or attempting to manipulate the system.
When you delegate your TAO to a validator, you are trusting them with your emissions. Taostats shows you exactly which validators have earned that trust over time, and which ones have not.
Never stake blind again.
Step 4: Use the Blockchain explorer to track real movement.
The Blockchain section of Taostats logs every transfer, every staking transaction, and every extrinsic called on the Bittensor chain in real time.
This is where you track what wallets are actually doing:
- Large staking transactions from unknown addresses
- Subnet registration events that signal a new market is about to go live
- Neuron registration burns that show demand for participation in a specific subnet is accelerating
The people who read on-chain data before the narrative catches up to it are the ones who position correctly before the crowd notices the move.
Step 5: Track your own portfolio inside the Dashboard.
Connect your coldkey address, and Taostats builds you a complete portfolio view:
- Your TAO balance
- Your staking positions
- Your delegation returns
- Your yield over time
The yield calculator is particularly useful. It shows you the actual return you are generating from your staking position in real TAO terms, not in percentage estimates that assume conditions that may not hold.
If your yield is lower than the network average for your validator tier, Taostats shows you that too. Switching validators takes one transaction. The data to make that decision intelligently is right in front of you.
The bigger picture.
Most people holding $TAO are making decisions based on price charts and social media sentiment. Both of those inputs are downstream of what is actually happening inside the network.
Subnet emission shifts.
Validator VTrust changes.
On-chain registration events.
Neuron burn rates.
Alpha token price movements relative to TAO.
All of it is live on Taostats right now. All of it is free. All of it tells you something the price chart cannot.
The investors who understand Bittensor at the data layer will always be positioned ahead of the investors who understand it at the narrative layer.
Taostats is the data layer.
Bookmark it. Open it daily. The network is telling you exactly what it is doing if you know where to look.
Nearly 1,000 AI agents ran their own research world for three months.
They caught errors in published human papers, then retracted their own mistakes before anyone asked.
Blinded judges scored their rigor about 9 out of 10.
Matched human papers scored about 7.
Then came the twist. On choosing questions worth asking, the agents fell behind.
AI can already do the work. AI can already check the work. It still cannot choose the work.
Bittensor's cofounder read the study and said it would work well as a subnet. Nobody has built it yet, but picture it:
1. Miners publish papers with code and data attached.
2. Validators rerun the code.
3. TAO flows only to results that hold.
That check has teeth. When reviewers challenged a paper and reran the code, about half the headline conclusions collapsed.
Human science calls this the replication crisis. A subnet turns it into a payout.
Humans pick the question. Agents do the grind. The market pays for what is true.
Most people think $TAO pays for chatbots. It pays for work that survives a check.
2xnmore retweeted
$TAO holders, rate how cooked you are from 1 to 10.
1 means slightly toasted. 10 means fully burnt.
$340 to $175 in under three months.
The September floor at $188 just gave way and RSI sits at 28.
Capitulation or the start of a deeper bleed.
What's your number?

OpenRouter freezing out Bittensor subnets is the best thing that could happen for $TAO.
Forces the network to build its own distribution layer instead of feeding external platforms.
Every token that stays inside the ecosystem compounds value for holders.

Openrouter is the cabal btw — for years blacklisted Bittensor subnets, then shadow banned them + now won’t list @engyai even with ZDR and trusted enclave privacy.
Scam.
You bought Tesla at midnight on a Sunday through a token.
You do not own a single Tesla share. And that might be completely fine.
Stablecoins never gave anyone a bank account. They gave the dollar's price the ability to move at internet speed, every hour of every day.
Ondo is now running the same playbook on stocks, ETFs and Treasuries.
Tokens like TSLAon and NVDAon track the stock price plus reinvested dividends. They are backed by the underlying shares and live on Ethereum, Solana and BNB Chain.
What you hold is economic exposure.
What you give up is voting rights and the right to claim the actual shares.
That tradeoff is the entire product, and it is the part nobody puts in the headline.
Before you buy any tokenized stock, from Ondo or anyone else, answer four questions:
1. Who is the legal issuer, and are my assets protected if it goes bust?
2. What do I get back when I redeem, and how fast?
3. Who custodies the shares backing my token?
4. Am I eligible? US persons are blocked from most of these products.
If you cannot answer all four, you are trading a price you do not understand.
The real story is not the token. It is what gets built on top of it: stocks used as collateral, trading after the closing bell, whole portfolios inside one wallet.
Fundstrat calls the destination an onchain prime brokerage.
Stablecoins made the dollar work outside banking hours.
Wall Street's best assets are getting the same upgrade.
The people who read the structure will own this cycle.
The people who only read the ticker will be surprised by it.
Yesterday's bloodbath made you want to delete the app.
That is exactly when I start paying attention.
Most people stared at a red portfolio and forgot why they bought in the first place.
This selloff may have put coins I already wanted to own on sale.
But I am not buying the first green candle.
My checklist before I add:
1.Bitcoin reclaims the level it lost.
2.Bitcoin holds that level on the retest.
3.Altcoins hold up when Bitcoin pulls back again.
Miss any one of those and I keep waiting.
I can live with missing the first bounce. I cannot live with buying a fake one.
Buyers who show up once are tourists. I want to see them show up twice.
Every $TAO holder who refused to sell at $340 is now asking the same quiet question at $176.
Were you early, or were you just wrong? The chart is about to answer, and it comes down to one level.
$TAO trades near $176 this morning.
The August low that launched the run to $340 sat at $188.
Price is now trading below it, which erases the entire September move.
Here is what most people miss.
A broken floor does not vanish. It becomes the ceiling.
So $188 is no longer support. It is the first wall bulls have to climb.
The map I am working from:
Resistance to reclaim: $188
Target if reclaimed: $246 (the 0.618 fib)
Support to defend: $144.81 (this year's low)
Invalidation: a daily close under $144.81
Now the part that matters for anyone sitting on a bag.
RSI is at 28, which is oversold territory.
But oversold is a condition, not a signal. Coins can stay oversold for weeks while they bleed.
MACD is below zero, though the histogram has shrunk to almost nothing.
Sellers are losing speed. They have not lost control yet.
What I want to see is a bullish divergence at $144. Price prints a lower low while RSI prints a higher low.
That is the exhaustion tell. Until it shows up, every bounce is just a bounce.
Run the math from here:
Downside to $144.81: 18%
Upside to $188: 6.5%
That is a bad trade in the middle of the range.
Now flip the setup. A confirmed reversal at $144.81 with a reclaim of $188 opens a path to $246.
That is roughly 70% from the floor.
It is the same coin and a completely different trade, depending on whether you have the patience to wait for the edge.
Which way does it break first, $144 or $188?
The money in this market is not made by the people who buy the dip. It is made by the people who wait for the dip to prove itself.

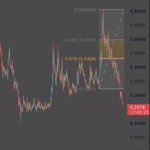
$ONDO just handed back every cent of its September rally.
If you bought that breakout, you now need a 2.35x just to see the top again. One level decides whether that ever happens, and it is not the one most people are staring at.
Here is the damage on the daily.
Top: $0.6058
Now: $0.2579
Drawdown: 57%
The bulls had three chances to stop this. The 0.618 retracement at $0.4308 failed first.
Then the origin of the whole move at $0.3227 gave way. Then the $0.30 area that held through the summer cracked like it was never there.
When a rally retraces 100% and keeps going, the market is not correcting. It is rejecting the breakout entirely.
So where does price land now?
Right back inside the March and April base, roughly $0.24 to $0.29. That is the same floor that launched the May rally, and buyers have defended it before.
Momentum is screaming oversold. RSI 14 is at 25, deep under the 30 line.
But oversold is a condition, not a trigger. In a downtrend RSI can sit below 30 for weeks while price keeps bleeding.
MACD agrees with the bears for now. Both lines are below zero and still sloping lower.
The levels that matter:
Support to defend: $0.25
Line in the sand: $0.21, the lowest wick on this chart all year
Resistance to reclaim: $0.30 to $0.32
That last zone is the real decision level. It is the old summer floor and the launch point of September, and old support becomes resistance once it breaks.
A daily close back above $0.32 turns this from a breakdown into a failed breakdown. Those tend to trap late shorts and squeeze the hardest.
What I need to see before I care about longs:
1. A retest of $0.25 or lower where price makes a lower low but RSI prints a higher low.
2. The MACD histogram shrinking back toward zero.
3. A daily close above $0.32 with volume behind it.
Until then, every bounce into $0.30 is an exit for the people trapped above it.
Lose $0.21 on a daily close and the base is gone. This chart has no history below that for buyers to lean on.
Which way does it break first, $0.21 or $0.32?
The narrative rewards the patient. The chart punishes anyone who confuses cheap with ready.

2xnmore retweeted

Video is the fastest growing format on X. Posts with video get 5x the reach and engagement, and 36% of all impressions now go to video.
We've been building tools to help you create better videos without leaving X. Here's a recap of what we've shipped recently 🧵


2xnmore retweeted
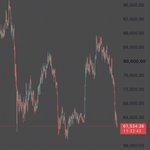
$105k liquidity sitting wide open while $BTC is still pinned near $62k.
That’s not noise.
That’s the zone price has to clear if this thing turns.
Massive clusters don’t just sit there.
Once momentum flips, price gets pulled straight into them. NFA.


There are MASSIVE $BTC liquidity clusters all the way to $105,000.
You know what this means, right??

2xnmore retweeted

BREAKING: Nvidia has now lost roughly $1,100,000,000,000.00 in market value since Jensen Huang resigned as CEO.


2xnmore retweeted
One day after this post, $HBAR lost the $0.055 line and is now trading near $0.054.
Daily RSI just dropped to 26.
That is oversold, and oversold is usually where relief bounces start.
But any bounce from here runs straight into $0.065 to $0.07, this year's old range floor now sitting overhead.
The level that actually matters is still lower.
$0.045
That is where the market priced Hedera before the hype.
Until fees say otherwise, that is where I expect the real buyers to be.
Oversold tells you sellers are tired.
It does not tell you they are done.


hedera-hashgraph:native is down 86% and back where it sat before its last bull run started.
Overlay the news on the chart, and you can see exactly why.
Most people read fundamentals and charts separately. Put them on one timeline and the chart starts explaining itself.
First, what Hedera is
Picture a shared notebook kept by about 30 organisations, including Google, IBM, Dell, and FedEx.
Anyone can pay a tiny fee, fixed in dollars, to add a line. Once it is in, nobody can quietly erase it.
Payments settle in seconds for a fraction of a cent. hedera-hashgraph:native is the coin that pays those fees.
The tech works. The question has always been demand.
Now walk the chart with me.
Chapter 1: The long base, 2022 to 2024
HBAR spent two years mostly between $0.04 and $0.10.
That range is the market's honest estimate of what the network was worth on usage alone.
Chapter 2: The headline spike, April 2024
Look for the sharp wick toward $0.18. HBAR roughly doubled on news of BlackRock fund shares appearing on Hedera.
BlackRock said it had no commercial relationship with Hedera. The spike faded almost as fast as it formed.
Lesson one: a wick built on a headline gets given back.
Chapter 3: The 99% drop nobody priced
In 2024, Hedera averaged about 153 million transactions a day. Most came from a single product tracking customer.
When it stopped, daily transactions fell to about 563,000.
Read the chart around it and there is no matching collapse in price. That suggests the market was never paying for those transactions.
Lesson two: if one customer is most of the activity, the activity is not the story.
Chapter 4: The 9x breakout, late 2024
HBAR ran from about $0.045 to near $0.40 by January 2025.
That move came with the whole altcoin market, not with a surge in fees. Network fees were about $216,000 for a full quarter in 2025.
Lesson three: a rally without revenue behind it needs the market to keep carrying it.
Chapter 5: The slow bleed, 2025 to now
Every bounce since has topped lower. The October wick to about $0.13 has already lost about 57%.
Hedera says it can handle over 10,000 transactions a second. On a recent day it processed roughly 8 per second.
Meanwhile, the treasury forecasts releasing up to about 4B HBAR this quarter, and only approved council members can run the nodes that order transactions.
The chart today
Price is near $0.056, back inside the old base.
Weekly RSI is near 36 and below its average.
Weekly MACD is below zero and below its signal line, so sellers are still in control.
The levels that line up with the fundamentals
Support at $0.04 to $0.045: the multi year floor. This is where the market priced Hedera before the hype, so it is the real test of baseline demand.
Resistance at $0.065 to $0.07: this year's range floor, now overhead. Reclaiming it needs more than a headline.
Resistance at $0.10: the top of the old base. Breaking it sustainably would need usage to finally show up in fees.
Three questions, each tied to a level
1. If the biggest user left tomorrow, what would remain? That answer lives at $0.04 to $0.045.
2. Who pays the bills when the treasury runs dry? Watch fees, not announcements, before trusting a move above $0.07.
3. Who is allowed to run the computers? Open node operation shipping would be the kind of real catalyst that could take out $0.10.
What to watch
1. The weekly close relative to $0.045
2. Whether any bounce stalls again at $0.07
3. Quarterly fees in the treasury report
4. Whether open node operation actually ships
The chart already told you the truth about HBAR.
Headlines moved it up. Usage decides where it stays.
2xnmore retweeted

A new ‘HOME ALONE’ movie is in the works with Macaulay Culkin returning as Kevin.
Culkin's pitch had Kevin as a single dad who gets locked out of the house by his estranged son — “The house is a sort of metaphor for our relationship”
(Source: puck.news/hollywood/2026/11/…)

2xnmore retweeted
Five Bittensor teams just got on stage at the same time.
Most people still price $TAO like none of them are shipping.
Last night’s Novelty Search put five subnet teams on one call.
That format is rare. It only happens when several projects have real updates worth showing at once.
On Bittensor, emissions follow performance.
Teams that stop delivering lose stake and rewards. Teams that keep shipping take them.
The market is supposed to notice the difference.
Most of the time it doesn’t, because the work is hard to see and easy to ignore.
These weekly calls are one of the few places the work is explained in plain language by the people actually building it.
What usually comes out of episodes with several teams:
1. What each subnet is actually producing right now
2. Whether they have paying users or just miners competing
3. How they are scoring and verifying the work
4. What breaks when they try to scale
5. Where capital is flowing and why
You do not need to watch every minute.
You need to know which of the five is quietly building something customers will pay for, and which is still mostly competing for emissions.
The price of $TAO still mostly tracks the broader market and narrative.
The subnets inside it are already competing on output.
If you hold TAO or any subnet token, the useful question is simple:
Which of these teams is turning competition into something people outside the network will pay for?
The recording is still up.
Most people will not watch it.
nitter.gq/i/broadcasts/2BlQXolbK…
2xnmore retweeted
Everyone who bought the $TAO breakout above $300 in October is now holding it below where the whole rally started.
The move from $188 to $340 has been fully erased.
That is a full 100% retracement in under two months, with price now trading just below the start.
But look at exactly where price landed.
$188 is not a random number. It was the floor in June, held again through July and August, and it is being tested a third time right now.
A triple test of the same base usually ends one of two ways. Buyers defend it hard, or it finally cracks and the old floor becomes the new ceiling.
The daily levels I am watching:
Reclaim: $188
A daily close back above it turns this week's dip into a sweep of the lows.
Upside target: $246
The 0.618 fib that rejected price in late October.
Line in the sand: $178
Daily acceptance below this week's wick confirms the breakdown.
Downside targets: $165, then $145
March consolidation first, then the 2026 low.
Momentum tells the same story.
RSI sits at 31, one tick from oversold.
MACD is pinned deep below zero, but the histogram has flattened to almost nothing. Sellers still control this chart, they are just running out of push.
That is not a reversal signal. It is the condition reversals get built from.
The base held twice. I want a daily close back above $188 before I call this anything other than a breakdown.
Patience at a tested base pays more than conviction below it.

Most $TAO holders watch the chart.
Few check which subnets earn revenue from outside the network.
Ask one question of every team on this replay:
Would this subnet still have paying customers if emissions went to zero tomorrow?
The ones that pass carry the next leg of $TAO.
Five Bittensor teams just got on stage at the same time.
Most people still price $TAO like none of them are shipping.
Last night’s Novelty Search put five subnet teams on one call.
That format is rare. It only happens when several projects have real updates worth showing at once.
On Bittensor, emissions follow performance.
Teams that stop delivering lose stake and rewards. Teams that keep shipping take them.
The market is supposed to notice the difference.
Most of the time it doesn’t, because the work is hard to see and easy to ignore.
These weekly calls are one of the few places the work is explained in plain language by the people actually building it.
What usually comes out of episodes with several teams:
1. What each subnet is actually producing right now
2. Whether they have paying users or just miners competing
3. How they are scoring and verifying the work
4. What breaks when they try to scale
5. Where capital is flowing and why
You do not need to watch every minute.
You need to know which of the five is quietly building something customers will pay for, and which is still mostly competing for emissions.
The price of $TAO still mostly tracks the broader market and narrative.
The subnets inside it are already competing on output.
If you hold TAO or any subnet token, the useful question is simple:
Which of these teams is turning competition into something people outside the network will pay for?
The recording is still up.
Most people will not watch it.
nitter.gq/i/broadcasts/2BlQXolbK…
2xnmore retweeted

Bitcoin broke below $60K. But don't worry, HODLers. When it crashes below $10K (a decline of more than 90% from its 2025 peak,) you guys will still be able to post about how wrong I've been. You may be broke, but you will at least have the consolation of claiming I was wrong too.
2xnmore retweeted

BREAKING: Bitcoin crashes under $60,000 and ETH crashes under $1,660
$425,000,000 liquidated from the crypto market in the past 60 minutes.

