Dedicated to making NY a better place to live and work by promoting public policy reforms grounded in free-market principles and personal responsibility.
- Tweets15K
- Following1.4K
- Followers4.9K
- Likes720




ALT Aerial view of the Hoover Dam spanning a rocky canyon. The structure holds back a large reservoir of water, with surrounding barren terrain and access roads visible. Two bridges cross the canyon, showcasing the engineering marvel in a desert landscape.

ALT Bar chart titled "Value for taxes" with survey responses about tax value in New York. The responses are categorized by demographic groups and voter intent, showing levels of perceived value: "Definitely getting good value," "Somewhat getting good value," "Somewhat not getting good value," "Definitely not getting good value," and "Unsure." Data is provided for various groups such as total population, race, age, income, and political affiliation, and regions including NYC, Western New York, and Long Island.

ALT Map showing U.S. states with extra gasoline costs for 20 gallons per week, October 2025-2026 vs. October 2024-2025. California ($725) and Washington ($672) have the highest increases. New York (up to $602) and Massachusetts ($621) also show significant rises. Other states with notable increases include Texas ($508) and Virginia ($544).

ALT Map of the United States showing gasoline price increases over the past year. States are color-coded based on the increase range: Missouri shows 3.76, Texas 3.98, Florida 4.17, California 6.36, New York 4.28, and Alaska 4.59. States with no data are in gray.

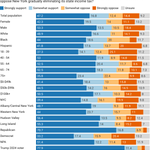
ALT Bar chart showing survey results on eliminating New York state income tax, broken down by demographics such as race, age, income, region, political party, and 2024 voter preference. Categories include "Strongly support," "Somewhat support," "Somewhat oppose," and "Strongly oppose." Notable groups include NYC, Biden 2024 voter, and Trump 2024 voter.