

The leading web platform for order flow, charting, scripting and trading. Free real-time data on CME, Nasdaq, NYSE, Cboe, NSE, MCX. Trusted by 3M+ traders.
USA
Joined April 2017
- Tweets14.1K
- Following393
- Followers19.5K
- Likes14.3K



Pinned Tweet
Charting and order flow in any browser. No install.
▲ DOM and order flow
▲ CME Group futures
▲ NSE and MCX
▲ Prediction markets
▲ Lipi scripting
▲ Digital assets and forex
Start free. Real-time data for some markets needs a paid plan.
gocharting.com/?utm_source=x…
Follow the money.
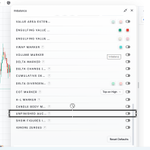
On Monday, /ES kept making lower lows into the afternoon, while Cumulative Volume Delta had already turned higher. The selling was drying up before the candles showed it.
See it for yourself with CVD on CME futures on GoCharting. Black Friday sale starts on Nov 23rd
Get Started: gocharting.com/pricing?utm_s…

ALT CVD on Cme futures on GoCharting
3M+ registered traders, and for 5+ years, we have been building GoCharting with them.
We believe the whole point of a trading platform is seeing the market move. That’s why we listen.
Join GoCharting:
• Order flow: footprint, delta, CVD, volume profile
• Drawing tools you can group, lock and hide
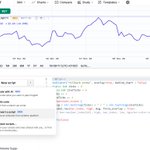
• AI-assisted scripting, including adapting scripts written in other languages
• Backtesting and Bar Replay
• Webhook alerts
• All in your browser, no download
Tell us what you need. Try now: gocharting.com/?utm_source=x…


Your setup took years to build. Switching shouldn't mean starting over.
Convert the scripts you already use, or describe a new one and AI scripting writes it.
This Black Friday, every GoCharting annual plan is 50% off, starting Nov 23.
Try AI scripting: gocharting.com/developers/li…
5
795
The FOMC minutes drop at 2:00 pm ET. The candle will show you where /ES went. The footprint shows you who pushed it there.
Real-time CME futures with footprint, CVD and Volume Profile. Right in your browser, no install.
Check out the CME Group Bundle gocharting.com/pricing?utm_s…
2
7
1,164
Before you take the trade, check this.
Footprint: did buyers actually step in?
CVD: does the move have fuel?
Volume Profile: where does the real volume sit?
Real-time on CME futures, in your browser.
Black Friday Sale starts on Nov 23.
Black Friday is coming to GoCharting.
Every annual plan: 50% off. Starts November 23
Get set up for free now so you're in on day one gocharting.com/pricing?utm_s…
Missed the 8:30 retail sales print?
Replay this morning’s /ES session bar by bar in GoCharting.
Start Free→ gocharting.com/?utm_source=x…
Same coin, three venues.
Watch BTC on Binance, Bybit and Coinbase side by side as US retail sales land at 13:30 GMT.
Try now → gocharting.com/?utm_source=x…

Got an indicator in your head for /ES?
Describe it in plain words and AI scripts builds it for your chart, from delta and volume to footprint-based ideas.
Try now → gocharting.com/?utm_source=x…
3
3
1,510
Order flow on a Mac, right in your browser.
Footprint, delta and volume profile on BTC and ETH, running in a browser tab. Open one before Warsh speaks at 17:00 GMT.
Try now → gocharting.com/?utm_source=x…
#BTC

1
9
1,196
BTC’s weekend on Binance, hour by hour:
Opened Saturday at 68,989 and slid into Sunday
Weekend low: 62,006
The next hour was the widest candle of the weekend, back to 64,900
Closed Sunday at 64,557, down 6.4%
Replay it candle by candle.
Try now → gocharting.com/?utm_source=x…
2
1,050
Community-built. Trader-tested. Worth a closer look.
Today's community Lipi script spotlight: Last Delta Divergence Range.
Built by a GoCharting community member, this script identifies the latest bar where price direction and delta disagree:
• Price closes up, but delta is negative.
• Price closes down, but delta is positive.
It then extends that bar's high and low as horizontal levels on the chart.
Why it matters: These divergences can highlight moments when aggressive order flow pushes against price direction. The levels give you areas to watch when price revisits them.
One of 7,000+ community-built Lipi scripts. Discover it and add it to your chart in one click.
Try it now
gocharting.com/features/comm…

Options chain in one tab, IV in another, payoff in a spreadsheet?
GoCharting’s Options Desk puts it together: a chain with 30+ metrics, payoff charts, IV skew, gamma exposure and 40+ prebuilt strategies.
Try now gocharting.com/features/opti…
2
9
1,527

PPI is out tomorrow at 8:30 AM ET. Know what's on the calendar before it moves your chart.
GoCharting's free plan includes economic and earnings calendars right next to your charts.
Start free on GoCharting
gocharting.com/features/char…

5
1,072
The best part of a trading platform? The community that grows, builds and pushes it forward.
Over the years, GoCharting users have gone beyond charting to create and share an incredible range of market analyses, custom indicators, and strategies.
Here's one community-built script worth a spotlight: "Crossroads", a BTC/USDT analysis tool that maps two possible market scenarios, along with the confirmation levels for each.
No predictions. No blind calls. Just a structured approach to reading the market.
From insightful community analyses to 7,000+ community-built Lipi scripts, there's a whole lot of creativity happening within GoCharting.
Explore what the community is building
gocharting.com/features/comm…
Community analyses and scripts are published by GoCharting users. Not investment advice

4
965
Hit the indicator limit again?
GoCharting's free plan has no cap on built-in indicators per chart. Stack RSI, VWAP, volume, even an indicator on top of another indicator.
Keep going.
Start free on GoCharting
gocharting.com/features/char…
Mac, Chromebook, iPad, or Linux? Your charts go wherever you go.
GoCharting runs right in your browser. No downloads, no installation, and no device-specific license. Just open your browser, log in, and pick up right where you left off.
Your trading workspace. Your device. Your way.
Try GoCharting: gocharting.com/features/trad…