

A boutique Power BI and Data Visualisation consultancy, based in Leeds, UK.
United Kingdom
Joined July 2021
- Tweets75
- Following54
- Followers9
- Likes1





Meet our new Data and BI Consultant, Shauna Duffy! A graduate of Ulster University with a BSc in Economics and MSc in Business Analytics from Queens Belfast, Shauna's also plenty of experience in Finance too! We know you'll love working with Shauna over the coming years!

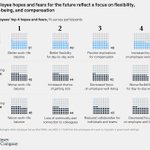
Opportunity or threat? Innovation is perceived as a double-edged sword in the #buildingproducts sector, but the winners will be those who dare to take risks.
Interesting article from @McKinsey.
ow.ly/R1PW50Jsi46


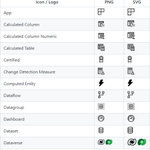
Make your #PowerBI apps and reports POP! Here's a free library of Power BI #icons, maintained by linkedin.com/in/jeroenterhee…. #UI #UX #Design
ow.ly/piK750IXlyX

Dare to Digitize?
The five steps to Digital Transformation. Get in touch to see how we can help you on your journey.
#Infographic by @Antgrasso
#DigitalTransformation #Digitalization

Hopton Analytics retweeted

How did I only find out about this library of Power BI icons maintained by @MarcLelijveld and @jeroenterheerdt today? Great resource for solution designs! lnkd.in/geWY6jie

Hopton Analytics retweeted

Even celebrities well known for their working-class upbringing are seen chiefly as upper class by younger respondents.
For example, the footballer Marcus Rashford is seen as upper class by 56 per cent of 18- to 24-year-olds compared with 10.3 per cent of those aged 55-64.

Migrating from #Tableau to #PowerBI. Here's a simple guide of what to unlearn from Tableau, and learn in Power BI. Includes video content.
hopton.link/Tableau-to-Power… community.powerbi.com/t5/Com…
Material Symbols is Google’s new library of modern #icons
#uidesign #UI #typography #design #symbol
ow.ly/zybx30shZoU

Conversational #AI tools should unify calling, messaging, analytics and more | #Bots need to connect #data between calls, messages too | via VentureBeat
ow.ly/M8HQ30shZoI
Make better chart choices. A fantastic visual vocab tool developed in Power BI by Jason Thomas (@SQLJason).
#Dataviz #PowerBI
hopton.link/Power-BI-Visual-…


#ChartDesignTip Tuesday! In reality, it's not quite as cut and dry as this, but in certain circumstances, highlighting key data points to help tell your users a story does make a lot of sense.

On Friday afternoon, this an interesting data visualisation covering a very important topic. Sorry, not a Topic, a Freddo... yougov.co.uk/topics/food/art…
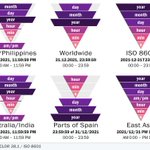
Day-to-day, I use the "Worldwide" date format as a Brit, but I always use the ISO 8601 for filename dates. What date format do you use, and more importantly has this visual changed for your mind?
#dataviz #datefight - (via hopton.link/DateFormat)

When you do use Pie Charts, consider some basic design rules.
#ChartDesignTip #data #powerbi #designtip #piechart

Not entirely accurate, but there's some truth to this #ChartDesignTip
#data #powerbi #designtip #piechart
