

Equipping the progressive movement with the data and insights it needs to win.
- Tweets11.8K
- Following11
- Followers68.9K
- Likes2K




ALT Split chart of Data for Progress polling. Title: Democrats Were Associated More With Economic Populist Messaging Than Moderate Messaging. Question: How often, if at all, have you heard Democratic candidates say each of the following during this year's election campaigns? Results by party (Dem / Ind / Rep): Billionaires and the wealthy should pay more in taxes: 84% / 80% / 71% Big corporations are raising prices to boost their profits: 80% / 70% / 62% Corporate landlords are driving up rents and should be stopped: 71% / 60% / 59% We should use every source of American energy, including oil, gas, and renewables, to lower energy costs: 61% / 43% / 39% We need to secure the border and enforce immigration laws: 51% / 33% / 39% Democrats will work with Republicans to get things done: 52% / 31% / 23% Oct. 31–Nov. 3, 2026 survey of 1,188 U.S. likely voters.

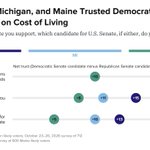
ALT Stacked bar chart of Data for Progress polling. Title: Swing Voters Didn’t Think Either Party Had a Solution for the Cost of Living, But Were Most Confident That Trump Did Not. Question: Do you think each of the following do or do not have a solution for the cost of living? (Has a solution / don’t know / does not have a solution, net): The Democratic Party: 16% / 30% / 53% (−37) The Republican Party: 11% / 25% / 64% (−53) Donald Trump: 14% / 16% / 71% (−57) September 11–October 19, 2026 surveys of 5,930 respondent interviews, including 428 U.S. swing voters.

ALT Bar chart of Data for Progress polling. Title: Ahead of the Election, Voters Were Hearing Most About Cost of Living, Iran, and AI. Share of likely voters who have heard "a lot" about each topic in the news recently: cost of living 66%, the war with Iran 57%, AI 55%, data centers 52%, immigration and deportations 48%, corruption allegations in the Trump administration 44%, Flock Safety license-plate cameras 34%, protests and riots in France 32%, federal Medicaid cuts 31%, the World Series 26%, the Fed raising interest rates 19%, and You Can See Everything, a new Elizabeth Holmes movie, 7% (50% have heard nothing at all). October 31–November 3, 2026 survey of 1,188 U.S. likely voters.


ALT Bar chart titled “Democrats Lead in ME, MI, and TX Senate Races.” In Maine, Democrat Troy Jackson leads Republican Susan Collins 50% to 45% (+5). In Michigan, Democrat Abdul El-Sayed leads Republican Mike Rogers 50% to 46% (+4). In Texas, Democrat James Talarico leads Republican Ken Paxton 49% to 45% (+4). Third-party candidates and undecided voters are shown in the crosstabs. Data for Progress surveys of 652 likely voters in Maine (October 23–27, 2026), 622 likely voters in Michigan (October 23–25, 2026), and 712 likely voters in Texas (October 23–26, 2026).

ALT Bar chart titled “Democrats Lead in ME and MI Races for Governor, Trail Narrowly in TX.” In Michigan, Democrat Jocelyn Benson leads Republican John James 52% to 43% (+9). In Maine, Democrat Hannah Pingree leads Republican Robert Charles 49% to 37% (+12), with independent Rick Bennett at 7%. In Texas, Republican Greg Abbott leads Democrat Gina Hinojosa 48% to 47% (+1). Third-party candidates and undecided voters are shown in the crosstabs. Data for Progress surveys of 652 likely voters in Maine (October 23–27, 2026), 622 likely voters in Michigan (October 23–25, 2026), and 712 likely voters in Texas (October 23–26, 2026).


ALT Bar chart of polling data from Data For Progress. Title: Voters Have a Negative Opinion of Private Jet Use for Transporting Celebrities, Politicians, and Wealthy People for Leisure. Description: Do you have a positive or negative opinion of private jets being used for each of the following purposes? To transport medical patients or medical materials (such as organ donations) for medical emergencies — Positive: 84%, Negative: 8% To deliver disaster relief supplies, rescue crews, and evacuees to areas commercial flights can't reach — Positive: 83%, Negative: 8% To transport sports teams for sporting events — Positive: 50%, Negative: 36% To transport animals, including pet dogs and race horses — Positive: 46%, Negative: 36% <strong>[SPLIT A]</strong> To transport company executives for business purposes — Positive: 39%, Negative: 46% To transport celebrities to events, such as concerts — Positive: 33%, Negative: 52% To transport politicians to campaign events — Positive: 32% Negative: 53%
ALT Bar chart of polling data from Data For Progress. Title: Voters Have a Negative Opinion of Private Jet Use for Transporting Celebrities, Politicians, and Wealthy People for Leisure. Description: Do you have a positive or negative opinion of private jets being used for each of the following purposes? To transport medical patients or medical materials (such as organ donations) for medical emergencies — Positive: 84%, Negative: 8% To deliver disaster relief supplies, rescue crews, and evacuees to areas commercial flights can't reach — Positive: 83%, Negative: 8% To transport sports teams for sporting events — Positive: 50%, Negative: 36% To transport animals, including pet dogs and race horses — Positive: 46%, Negative: 36% <strong>[SPLIT A]</strong> To transport company executives for business purposes — Positive: 39%, Negative: 46% To transport celebrities to events, such as concerts — Positive: 33%, Negative: 52% To transport politicians to campaign events — Positive: 32% Negative: 53%


ALT Bar chart of polling data from Data For Progress. Title: Socially Disengaged Americans Are Less Trusting in the Government. Description: How much do you agree or disagree with the following statements?— The government looks out for people like me. All U.S. adults — Agree: 27%, Disagree: 63% Very low — Agree: 16%, Disagree: 68% Low — Agree: 24%, Disagree: 64% Medium — Agree: 31%, Disagree: 69% High — Agree: 53%, Disagree: 45% September 4–9, 2026 survey of 1,098 U.S. adults.

ALT Bar chart of polling data from Data For Progress. Title: Socially Disengaged Americans Express More Negative Feelings About the Direction of the U.S.. Description: For each of the following, would you say things are going in the right direction or are on the wrong track?— The United States All U.S. adults — Right direction: 30%, Not sure: 13%, Wrong track: 57% Very low — Right direction: 24%, Not sure: 20%, Wrong track: 56% Low — Right direction: 29%, Not sure: 10%, Wrong track: 61% Medium — Right direction: 28%, Not sure: 12%, Wrong track: 60% High — Right direction: 45%, Not sure: 7%, Wrong track: 48% September 4–9, 2026 survey of 1,098 U.S. adults.
