IFreqs (@0xifreqs) header
IFreqs (@0xifreqs) profile picture

AI • DeFi • Stablecoins | On Chain Research & Alpha | https://nitter.gq/t.co/ViSbu7IqBT

Joined December 2017
Photo by IFreqs (@0xifreqs)Photo by IFreqs (@0xifreqs)Photo by IFreqs (@0xifreqs)Photo by IFreqs (@0xifreqs)Photo by IFreqs (@0xifreqs)Photo by IFreqs (@0xifreqs)Photo by IFreqs (@0xifreqs)Photo by IFreqs (@0xifreqs)Photo by IFreqs (@0xifreqs)Photo by IFreqs (@0xifreqs)
Solana just put a number on where its infrastructure is heading: 1,000,000 payments per second, live today through Payment Channels. The sharpest use case is agentic payments an AI agent firing hundreds of metered calls in a loop, now settled without a per call signature bottleneck and already wired to @alibaba_cloud API endpoints. ★ This lands mid upgrade: slot times are already down to 350ms, Transaction V1 goes live September 9, and the Alpenglow rewrite targets ~150ms finality in October. The regulatory side moved the same week today's SEC order on Nasdaq listing standards names $SOL among the digital commodities that already meet ETP eligibility. ★ The important shift is that @solana's performance roadmap and its real-world settlement demand are arriving together, not years apart. SOL trades near $104 with a $60.7B market cap while Orca and Raydium grew 30-day fees more than 64%. The next metric to watch is Payment Channels throughput in production and whether Alpenglow ships on schedule in October. The broader signal is that Solana is moving from a high throughput trading chain toward institution grade, machine speed settlement infrastructure.
1,000,000 payments per second. Live on Solana today with Payment Channels. Agentic payments have a friction problem. Every call an agent makes needs a signature and a settlement. It works well enough for a single payment, but it's broken for an agent making hundreds of metered calls in a loop. Live on Solana today with @alibaba_cloud API endpoints, which are payable through Payment Channels on pay.sh.
68
6
1
280
51,352
Tokenized Treasury funds shrank 5.1% in 30 days, to $14.12B, per @RWA_xyz. That's with the 3-month T-bill still paying 4.00%. So it isn't the yield. The 90-day flows show who's leaving: ~BUIDL -$950M, USYC -$931M, JTRSY -$827M, USTB -$367M ~BENJI +$520M, SHVon +$352M, USDY +$240M ~JTRSY is basically one address: Grove, the capital allocator of @SkyEcosystem, sent out ~770M tokens since August and now holds zero That's a pretty interesting split. The funds bleeding are the ones crypto balance sheets use. @BlackRock's BUIDL backs Ethena's USDtb, @circle's USYC is Binance collateral, JTRSY was Grove's. The funds growing are sold to wallets and retail apps. My read is tokenized T-bills are still mostly a DeFi reserve asset. When onchain dollars shrink, they shrink too, whatever the yield. But I wouldn't call it a DeFi-only market anymore. @FTDA_US's BENJI added $399M in one week, after the SEC cleared Franklin's own ETFs and mutual funds to use it for cash management. Can tokenized Treasuries grow if stablecoins don't?
85
1
11
125
8,395
One wallet moved $676M from @SkyEcosystem's savings vault into @aave in under 12 minutes on Nov 6. On paper it was an easy trade. sUSDS paid 3.80%. Aave's $USDC pool on Ethereum was 95% borrowed and paying 5.82%. Then the deposit itself cut Aave's rate to 2.38%. ~Two hours later Aave raised the pool's borrow cap from $2.27B to $2.60B ~Borrowed USDC went from $2.24B to $2.57B, 99% of the new cap ~The rate is back to 3.28%, still below what the wallet left ~Its sUSDS balance was identical on June 1 and Oct 28 That last line is the interesting one. sUSDS has paid less than a 3-month T-bill (now 4.00%) every day since June 1, and its deposits fell from $5.88B to $3.94B. This wallet sat through all of it and only moved for a 2pp spread. My read is big onchain dollars follow the spread, not the brand. And on Aave, USDC demand looks capped, not weak. But this is one wallet, we don't know whose, and these rates move every block. Does Sky lift its savings rate back above T-bills, or let deposits keep leaving?
85
10
121
8,215
$ETH just had its best day since Sep 18: +6.6% on Nov 4, from $2,275 to $2,425, on ~1.5x average volume. It also beat bitcoin (+3.9%), and ETH/BTC is up 6% from its Oct 30 low. Yet traders leaned the other way. Binance OI barely moved (2.37M ETH), but its long/short account ratio fell from 3.30 on Oct 30 to 1.83, a 30-day low. ~First ETF inflow (+$53M) after seven outflow days (-$656M), per @FarsideUK ~$115M of ETH shorts liquidated in 24h (longs: $83M), per @coinglass_com ~Back above the 20-day ($2,352), still below the 50-day ($2,508) That's a pretty interesting setup: price is up, but positioning is fading the move. My read is ~$2,500 is the real test. ETH lost the 50-day on Oct 8 and hasn't closed above it since. Hold $2,225 and the squeeze case stays alive. But this was a post-midterm relief day, and one ETF print isn't a trend. Are the shorts fuel for the next leg, or the smart side of this bounce?
95
10
103
8,160
$BTC swept $75.7K overnight and was back above $78K within three hours. That's the third time in six days the $75.7K–$76.4K zone has held: $76,326 on Oct 30, $76,389 yesterday, $75,736 today. Since September, only Sep 15–16 traded lower ($74,968). Yet the trend picture hasn't improved. Price is still below the 20-day ($80.2K) and 50-day ($82.0K) averages, and daily RSI sits at 43. ~Above the 200-day ($73.2K) since Aug 19 ~Binance futures OI +5% since Oct 26 (98.7K BTC) while price fell ~US spot ETFs -$1.16B over the last three sessions, per @FarsideUK ~Fear & Greed at 34 That's a pretty interesting mix: buyers keep defending the same floor, but leverage keeps building into it. My read is $79K–$80K is the level that matters. A daily close back above it makes Oct 29 look like a fake breakdown. Lose $75K and the 200-day is next. But one wick isn't a reversal, and rising OI can flush either way. Which breaks first, $80K or $75K?
90
10
112
7,831
640 memecoins launched on @Pumpfun are still worth more than $100K today. The next launchpad has 290. That's a pretty clear gap for a market everyone calls competitive. I counted every pool with $100K+ FDV and $10K+ liquidity across Solana, BSC, Base, Robinhood Chain and Monad via @GeckoTerminal: ~Pumpfun 640 (145 above $1M) ~Flap 290 (95 above $1M) ~Pons 129 ~FourMeme 55 ~BonkFun 24 ~Bags 8 Meanwhile Pumpfun made $42.9M in 30-day revenue, ~7x the next launchpad, per @DefiLlama. My read is no Solana launchpad comes close on surviving tokens. The real challengers live on other chains: @flapdotsh on BSC and Pons on Robinhood Chain. But FDV isn't liquidity, and older Pumpfun tokens without the "pump" address suffix aren't counted. Which launchpad would you move up a tier?
113
11
113
6,081
$BTC's -7.3% was the smallest drop on this list. Coinbase fell 23%, Robinhood 24.5%, $ETH 16.3%. Meanwhile the S&P 500 ended October down just 0.9%. That's a pretty interesting split: the selling hit crypto and high-beta tech, not the broad market. It's also Bitcoin's first back-to-back red October since 2011-2012, per @coinglass_com. The flows, per @FarsideUK and @DefiLlama, told the same story: ~$516M out of US spot BTC ETFs, the first net-outflow month since June ~$1.61B out of ETH ETFs, their worst month of 2026 ~Stablecoin supply slipped from $305.8B to $299B My read is Bitcoin traded like the defensive end of crypto, while crypto-linked names fell more than twice as hard. But a month that ended with a $6.3B exchange hack isn't a clean signal. And after the last five red Octobers, November was green only twice. Is October's relative strength worth anything in November?
"Uptober" market recap: • BNB $BNB: -8.4% • XRP $XRP: -16.2% • AMD $AMD: -17.5% • Intel $INTC: -45.3% • Bitcoin $BTC: -7.3% • Micron $MU: -16.9% • Meta $META: -15.2% • Solana $SOL: -18.8% • Nvidia $NVDA: -10.4% • Reddit $RDDT: -35.6% • SpaceX $SPCX: -10.7% • Ethereum $ETH: -16.3% • Google $GOOGL: -18.7% • Coinbase $COIN: -23.0% • Robinhood $HOOD: -24.5%
113
1
10
130
7,024
Tether froze more than 1.567B USDT tied to the Binance hack within hours. Then came its Q3 attestation yesterday: $1.5B in net operating profit. That's a pretty interesting week for one company. What the report shows, as of Sep 30: ~$191.5B in assets vs ~$183.5B in liabilities ~$7.95B excess reserves, up from $4.1B in Q2 ~$132.4B in US T-bills, direct and indirect ~10% in precious metals, ~4.4% in bitcoin At Q3's average 3-month bill yield of ~3.8%, those T-bills alone earn roughly $1.25B a quarter. My read is Tether's profit is mostly a rates business now, not a growth one. $USDT supply went from $187.3B on Jan 1 to ~$180B now, per @DefiLlama. But the Sep 30 numbers predate this week, and the T-bill math is my estimate, not Tether's breakdown. Does Tether even need supply to grow, as long as rates stay near 4%?
Tether froze more than 1.567B USDT related to a potential Binance exchange hack. Protecting the industry and our partners is our main priority. Stay safe everyone.
109
1
3
209
6,613
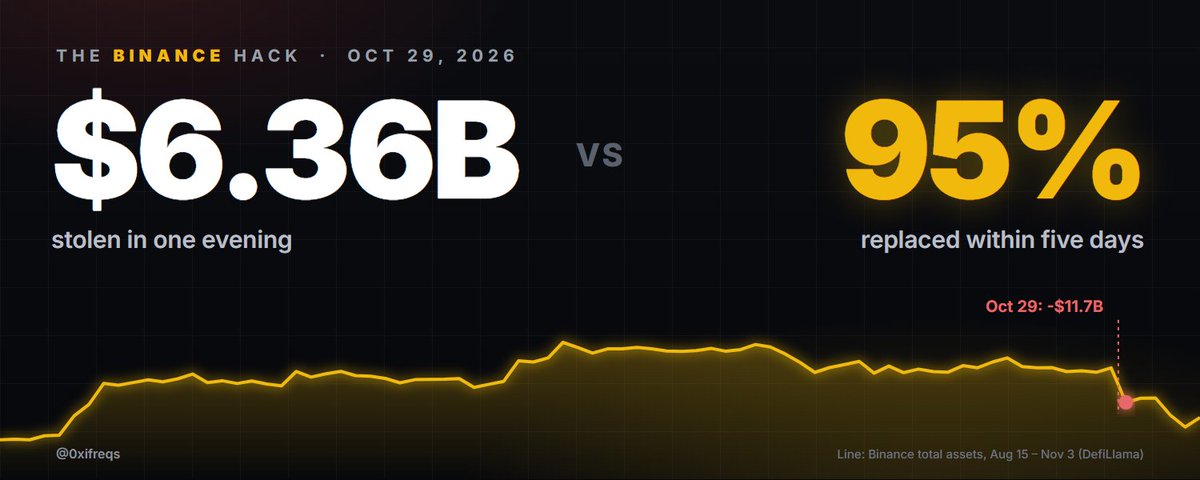
Binance says it has set aside $6.34B of company funds to cover the hack. $5B of that was already sitting in the exact tokens that were taken. That's a pretty interesting detail. The rest of the picture so far: ~$5.9B–$6.4B stolen, depending on who's counting ~4x Bybit's 2025 hack, the previous record, per @chainalysis ~$3B frozen, mostly stablecoins @DefiLlama tracked Binance at $144.9B the day before, so this is roughly 4% of its assets. My read is solvency isn't really the question here. What I'd watch is the other ~$1.3B, which Binance is buying on the market and OTC, some of it in low-liquidity tokens. But the final loss number isn't settled, and frozen doesn't mean recovered. If stablecoins can be frozen and $BTC can't, does that change what exchanges keep in hot wallets?
Binance has begun recovering affected assets for users and continues to work with law enforcement, issuers, blockchain intelligence firms and industry partners to trace, freeze and recover additional funds. The company has already publicly committed to cover losses through company funds in the prior announcement. Binance has already reserved over $6.34B of company funds to cover this incident. $5B of these funds are already held in the exact token assets that were impacted. We are completing the purchase of the remaining amount by buying token assets through market channels and OTC channels. We are doing this to match the format of the remaining token assets and address any asset shortfalls. This step can take longer because some tokens may have low liquidity and OTC settlement also takes time. We will share more progress as soon as we can. These figures do not include frozen or protected assets, which remain subject to ongoing recovery and verification. Currently, $3bn has been frozen, with thanks to our industry partners. We are working with partners and law enforcement to recover the frozen assets.We will continue to use company resources to cover confirmed shortfall and will provide further verified updates as recovery efforts progress. Ultimately, all user funds will be verified publicly through our Proof of Reserves. We will weather this storm. Thank you for the support.
92
3
5
194
7,984
The Fed held at 3.75–4%, but two members voted for a hike. Bitcoin's reaction: $80.9K → $81.8K in two hours, then $79.7K overnight. ★ What @federalreserve signaled (Oct 28) → A pause after September's 25bp hike. Vote 10–2: Cook and Hammack wanted another 25bp now. → The statement still reads "Inflation remains elevated." → @CMEGroup FedWatch prices a December hike at 79.6%, up from 73.3% a week ago. @Polymarket has it at ~79%. ★ What $BTC is doing → Stuck between ~$79K and ~$87K since Sep 21 (chart: @Investingcom). → The September hike didn't stop the breakout. BTC closed hike day at $76.2K and hit $87.4K five days later, as spot ETFs took in $2.39B in the week of Sep 21 (@FarsideUK). → October ETF flows: just +$110M net through Oct 28, even after +$424M in the last three sessions. → Binance perp OI is ~95.8K BTC, inside a 92.4K–98.2K band all month. Funding has stayed at or below the 0.01% per 8h baseline all week (~0.006% now). Leverage isn't chasing a breakout either. → Caveat: Binance is one venue, and Farside's latest day can still be revised. Prices in the text are Binance; the chart is Bitfinex. My read: the hike is mostly priced. What moved BTC in September was ETF demand, and that's what's missing now. Does BTC need the Fed to blink, or just the ETF bid to come back?
97
6
2
181
8,223
Robinhood's crypto revenue fell 55% to $120M. Its chain did $80B+ in DEX volume in its first quarter. Same company, two very different crypto numbers. ★ What $HOOD reported (Q3, 8-K) → Record revenue of $1.42B, +12%. Net income $476M, −14%. → Crypto volume in the app was $21B (−48%), and on Bitstamp $29B (−28%). → Event contracts brought in $173M, up 6x+. Prediction markets now out-earn crypto. → Robinhood Chain: top-5 by revenue and volume, $80B+ DEX volume, $50M+ in chain fees. ★ The chain onchain (@DefiLlama) → Q3 DEX volume was $90.7B by DefiLlama's count, roughly 4x the app's own crypto volume. → It's #4 by 30-day DEX volume ($29.4B), just behind Base ($29.8B), and #5 over 7 days. → But it peaked early: ~$18B in the week of Aug 31, $5.35B in the week of Oct 19 (−71%). October is running at about half September's daily pace. → Uniswap does ~80% of the last 30 days' volume. → Caveat: the release doesn't say how much of the $50M in chain fees Robinhood books as revenue. HOOD traded ~8% lower in early pre-market after the print. Robinhood is growing a chain while its crypto app shrinks. Does the chain keep the volume once the launch wave fades?
Robinhood Markets has just released financial results for the third quarter of 2026.
119
3
194
8,037
Solana's DEX transaction count is up 65% YoY. The dollars didn't follow: weekly DEX volume is down two-thirds. ★ Counts vs dollars (Nov 3–9, 2025 vs Oct 19–25, 2026) → DEX transactions: 100.8M → 152.5M a week, +51% (@Dune). → DEX volume: $44.5B → $14.8B, −67%. @DefiLlama shows −68%. → Average trade: ~$441 → ~$97. → Daily DEX traders: 753K → 906K, +20%. Each now makes ~24 trades a day, up from ~19. ★ What it means for the chain → $SOL averaged $104 last week vs $161 in that November week, −35%. → Fees rose 23% in SOL but fell in dollars: $5.5M → $4.4M a week. → App revenue: $31.1M → $30.1M a week. It peaked at $42.5M in the week of Sep 7, the same week DEX transactions peaked at 189M. Since then revenue is −29% and transactions −19%. → Caveat: I couldn't reproduce @solana's +65.4%, because the site's data only goes back to Oct 28, 2025. Against the first full week inside that window, I get +51%. Providers also disagree on the count: last week ranged from 129M (Top Ledger) to 365M (Solscan). More trades, smaller tickets, flat revenue. Is that organic demand, or bots splitting orders?
JUST IN: Solana weekly DEX transactions up 65.4% year over year.
77
4
7
160
6,705
SoFi just gave consumers a tokenized deposit: 4.40% APY, FDIC-insured, convertible 1:1 into its stablecoin. Banks are shipping this RWA lane now. The token crypto traders tie to it, $QNT, is up ~15% in 24h. ★ What $SOFI launched (Oct 22) → Each SoFi Earn (SOFIE) token is $1 on deposit at SoFi Bank. → It converts 1:1 into SoFiUSD to buy crypto or move funds onchain 24/7. The stablecoin itself pays nothing. → SoFi's pitch: Fed research puts ~$64B, or 21.2% of stablecoins, idle in inactive wallets. ★ The bank pipeline → The Clearing House picked Quant on Sep 24 to power the interoperability layer of its tokenized deposit network, linked to the RTP and CHIPS rails. TCH clears $2T+ a day. Launch is set for H1 2027. → JPMorgan's deposit token has run on @base since Nov 2025. → Five regional banks, including Huntington, M&T and KeyBank, chose ZKsync for the Cari network. ★ The token (@coingecko, @coinglass_com) → ~$213 now, ~+250% in 3 months: a $55.9 close on Aug 18, a $373 high on Sep 27, a $179 close on Oct 24. → Today's move is futures-led: $784M futures volume vs $85M spot in 24h. OI +22% on Binance and +38% on Bybit. → Liquidations were small ($1.04M, $719K of it shorts) and funding is flat. That's new positions, not a squeeze. → Binance long/short accounts went from 0.93 on Saturday to over 1.2. → Caveat: SoFi's release doesn't name Quant, and TCH's never mentions the QNT token. Nothing ties network fees to it. Trackers also disagree on supply: CoinGecko counts 14.56M circulating ($3.10B), CoinGlass 12.07M ($2.59B). Tokenized deposits are clearly coming. Do they need QNT, or just Quant the company?
JUST IN: 🇺🇸 $SOFI launches FDIC-insured tokenized deposits.
108
8
4
182
7,881
Bitcoin dominance is holding ~60.6%, a level last seen in late May. But $BTC is down 5% in 30 days. The share went up because everything else fell harder. ★ The chart (@tradingview, BTC.D) → 60.6% now, up from 59.4% on Sep 24. → Above its 50-day (59.8%) and 200-day (59.6%) averages. RSI is 67, close to the 70 line. → The 1-year ceiling is ~61%: a 61.4% wick on Nov 4, 2025 and a 61.1% close on May 5, 2026. ★ Where the share came from (last 30 days) → BTC −5.0%. Total crypto market cap −7.0%. Everything except BTC −9.8%. → ETH/BTC −8.9% to 0.0290, RSI 25. $ETH dominance is down to 10.7%. → USDT dominance +6.7% to 6.87%. Stablecoins don't fall in a selloff, so their share rises by default. ★ The last two times BTC.D reached ~61% → Nov 2025: BTC.D fell from 60.8% to 59.1% by Nov 21 as BTC dropped 16%. USDT + USDC dominance rose 1.2 pts. ETH/BTC was flat. → May 2026: BTC.D fell from 61.1% to 57.9% by Jun 3 as BTC dropped 21%. USDT + USDC rose 1.8 pts. ETH/BTC −3%. → Both times, stablecoins took more than half of the share BTC lost, and ETH's share fell too. → Caveat: TradingView counts stablecoins in the total. Without USDT and USDC, BTC's share is ~67%. @coingecko shows 60.1% because it tracks a different set of coins. And two tops aren't a pattern. BTC.D is back at the ceiling with RSI near 70. If it rolls over again, is that an alt season, or another move into stablecoins?
132
9
6
220
7,879
Oct 28 FOMC: @CMEGroup FedWatch prices a 90% hold, with hike odds down from 68.6% to 10% in a month. → After the Sep 16 hike, $BTC rose 10.7% in a week vs Nasdaq 100 +5.3%, S&P 500 +2.0% and gold −1.6%. → Since Sep 24 the hike got mostly priced out, yet BTC and Nasdaq both fell ~5% and gold 6.7%. ★ A hold is priced in, so it may not move BTC much; a surprise hike is the real tail risk.
77
6
3
167
8,603
Banks found AI agents inside customer accounts. The interesting part isn't the agents. It's how they got in. > Per Axios, Morgan Stanley, BofA, JPMorgan and Wells Fargo spotted third-party agents in customer accounts, in some cases using logins the customers handed over themselves. > Some banks are blocking them. Others are restricting what they can do. > Jamie Dimon reportedly called it a "liability transfer" to the customer. That last line is the one I keep coming back to. An agent that needs your bank password is borrowing your identity. Crypto has been building a rail where it doesn't have to. x402, the @coinbase standard, lets an agent pay for an API call with stablecoins. No login involved. Ran the numbers on Agent Economy's tracker (public Dune data): • 194.8M payments settled • $42.2M in total volume • ~$0.22 per payment on average • 96.7K payments yesterday • 45% of all payments have settled on @base So the rail exists. The money on it doesn't, yet. ★ My read: if banks shut the password-sharing door, agent payments get pushed toward permissioned rails, meaning bank APIs or stablecoins. At ~$0.22 per payment, x402 is still a micropayment rail, not a money rail. Which one gets the agent volume first?
JUST IN: 🇺🇸 Morgan Stanley, Bank of America, JPMorgan, and Wells Fargo detect unauthorized AI agents accessing customer accounts and attempting to act without user instructions.
113
1
9
196
7,852
On this call, CEO @vnovakovski said Lighter will file with the CFTC in November. LIT jumped ~20%. Here's what the headline leaves out. ★ What was said (as reported from the call) → Lighter plans to apply for two CFTC licenses: designated contract market (DCM) and derivatives clearing organization (DCO), aimed at US institutions. → The team says it has talked to regulators for ~11 months. Reviews can take up to ~280 days, so approval could stretch into 2027. → Robinhood: no partnership has been confirmed. Today, Robinhood Wallet users can trade Lighter perps only outside the US. Lighter already runs perps on Robinhood Chain. → Lighter Core passed 1M accounts. ★ The exchange (@castle_labs) → Lighter OI is $773M, 5.6% of onchain perps (4th). That's +6.5% in 7 days and −7.5% in 30. → 24h volume is $3.1B, 3rd behind Hyperliquid and Variational. ★ The token (@coingecko, Tokenomist) → $LIT is ~$3.64: +23.7% in 7 days, but still −23% in 30 days and −54% from its $7.86 high (Dec 30, 2025). → Only 250M of 1B tokens circulate. Market cap $912M, FDV $3.58B. → Team (26%) and investors (24%) have a 1-year lock from the Dec 30, 2025 TGE, then 3 years of linear vesting. That lock ends around late December 2026, before any CFTC decision. → Since launch, 18.1M LIT (6.9%) has been burned and 18.4M (7.1%) bought back. → Caveat: the license plan comes from the call and press coverage; nothing has been filed yet. Trackers put the vesting start a few days apart. Lighter pitches a US license as a first for an onchain perp DEX but the unlock clock runs faster than the CFTC's. Which one does LIT trade on?
We’re excited to share the recording of our Q3 Investor Update call. Thank you to everyone who joined, we’re building Lighter with you, and for you. On to Q4 🕯️
114
9
2
199
7,932
Memecoins are bleeding. The memecoin factory just had its best month since March 2025. ★ The coins (@coingecko) → The meme category is worth ~$31.0B, about 1.1% of the whole crypto market. → 7 of the 8 largest memes are down over 30 days: $DOGE −13.8%, $SHIB −11.9%, $PEPE −5.5%, $TRUMP −11.5%, $PENGU −4.5%, MemeCore −48.8%. → Most are far from their highs: DOGE −89%, SHIB −94%, PEPE −83%, TRUMP −97%. → The only one up is $PUMP, +15.0%. ★ The factory (@DefiLlama) → Pumpfun took in $62.6M in fees over the last 30 days, +37% on the 30 days before. That's its best 30-day stretch since March 2025. → Its launchpad earned $45.4M in that time. The next one, BONK(.)fun, earned $3.7M. That's ~89% of tracked launchpad revenue. → $30.8M of pump revenue went to PUMP buybacks in 30 days. Annualized, that's ~16% of PUMP's $2.34B market cap. → On DefiLlama's weekly comparison, pump(.)fun out-earned @HyperliquidX in 2 of the last 4 weeks. → Caveat: fees come from churn, and most new launches go to zero. Buybacks shrink when volume drops. And 54% of PUMP's supply isn't circulating yet (FDV $4.19B). The coins are down and the platform is printing. Is this a meme cycle, or just a busy casino?
88
11
174
5,566
Solana gets Alpenglow tomorrow, and its tokenized-stock base keeps growing. SOL's chart tells a different story. Five datasets: ★ The network side is growing (@RWA_xyz) → Tokenized stocks on Solana: $504M, +6.3% in 30 days. That's 3rd, behind BNB Chain ($1.5B, +37.6%) and Ethereum ($737M). → Solana's share slipped to 14.7% while BNB Chain's rose to 42.8%. → RWA holders on Solana: 824K, +39.9% in 30 days. RWA transfer volume: $10.4B, +68%. → Alpenglow goes live on mainnet-beta Oct 21 (@anza_xyz), targeting ~150ms finality. ★ Momentum is fading (@tradingview) → Daily RSI(14) is ~40. It peaked near 86 on Aug 24, and at the Sep 25 high (~$122 close) it only reached ~69. → $SOL is below its 50-day average ($109.5) and above its 200-day ($87.9). SOL/BTC is −6.6% in 30 days. → It's still 59% below its $253.5 high from Sep 2025. ★ Leverage is building, not leaving (@coinglass_com) → On @binance, SOL OI in coins is +9.7% in 30 days while price is −6.2%. BTC went the other way (OI −13.5%). → Aggregate OI is $6.35B, down from ~$7.6B at the late-September peak, mostly because the price fell. ★ Retail is leaning long → Binance accounts are long 2.48 to 1 (71%), up from 1.79 a month ago. BTC is at 1.77, ETH at 3.08. → In early June, the same ratio hit ~4 right near the bottom. → Caveat: RWA(.)xyz counts only the tokens it tracks. Solana's reported 1.4M tokenized-stock holders comes from a different (Blockworks) methodology. And Alpenglow changes finality, not demand. A faster chain, more stock holders, and more leveraged longs on a weaker chart. Does Alpenglow change the flow, or is it already priced in?
115
11
1
188
8,645
JPMorgan is putting JPM Coin on Ethereum. The ETH chart hasn't noticed yet, and four datasets show why. ★ The news, without the hype → JPMD, JPMorgan's dollar deposit token, launched on Base in Nov 2025. Now it's on Ethereum too, through Kinexys. → It stays permissioned: only approved institutional clients can hold or move it. → Kinexys says it has handled $4T+ in total, about $7B a day. ★ Momentum is weak (@tradingview) → Daily RSI(14) is ~37. It peaked near 88 on Aug 21, and at the Sep 21 high (~$2,776 close) it only reached ~72. That's the same divergence BTC showed, only deeper. → $ETH is below its 50-day average ($2,551), though still above the 200-day ($2,150). → ETH/BTC is down 9.6% in 30 days, to 0.0293. ★ Rainbow: "BUY!", one band above BTC → BlockchainCenter's power-law rainbow has ETH in the "BUY!" band for 12 days, 66% below the model center. → BTC sits one band lower, in "Fire Sale". ETH is still 52% below its $4,957 high from Aug 2025. ★ Leverage didn't leave with the price (@coinglass_com) → On @binance, ETH OI is −4.2% in 30 days while price is −8.8%. BTC was the opposite: OI −13.5%, price +1%. → Aggregate ETH OI is $30.8B, down from ~$36B at the late-September high. ★ Retail is far more crowded than in BTC → Binance accounts are long 2.94 to 1, about 75% of accounts. For BTC it's 1.60. → The ratio peaked at 3.40 early today, and top-trader accounts went from 1.23 to 2.35 in a month. → Taker flow leans slightly to sellers: ~49% buys vs ~51% sells over 4 hours. → Caveat: JPMD is permissioned and settles in dollars, so it doesn't need ETH demand to work. Account ratios count traders, not dollars. Better institutional news, a weaker chart, more crowded longs. Which one gives first?
77
5
160
5,554