

Elliot Wave Analyst Click the link for access to more of my analysis
Joined July 2020
- Tweets9.3K
- Following103
- Followers22.2K
- Likes5.4K



Pinned Tweet
$SPY Peaked at 781.62 as of this time.
$1.62 above my target given 6 months ago for this primary wave 3.
With $SPY now below the 50D EMA for the second consecutive session. The risk grows as buyers struggle to regain momentum.
With each passing day we build below the 50D EMA.
The more likely it is that continuation down into the 200D EMA can and will follow next.
I remain confident that this is just the start to primary wave 4(red circle 4) as we venture back to $683, $619-$629, $600.


$SPY Weekly 🎯745 | 766 | 780
• Extended wave 1 = shorter wave 3. As long as wave 5 peak is < $850 this count works.
• I Initially had Feb 25' as wave 3 high but that's a bit short for standard wave 3's.. I've pushed that out to 750-780 range
• Internal wave 3 count(blue) looks like a diagonal but measures as an impulse
*This does not imply a vertical ascent... the line to wave 5 of 3 is associated to the label by TV default*

$SPY As I said 3 years ago.. History doesn't always repeat.. but it often rhymes
in 2023.. I put together a compelling thread about how 2011 and 2022 were very similar
Once in a life time crash -> 2 year rally - > multi month bear market(2011/2022) -> Possible historical bull market follows.
that thread was spot on.
Just a look back at the 2011 fractal compared to now.
The similarities are still insanely similar.
Especially when you look at 2014 V shape recovery to ATH that was then followed by multiple months of low volatility in the form of a rising wedge..


how confident?
5 months before the correction in 2026 I called it both in chart and text analysis.
The market found bottom at 628 and I expected 613.. so slight margin of error. I also said a rocket higher for Q2/Q3 of 2026.
xitter.cf/ATMSnipes/status/19773…
In april 26' I said 780 is the upside target for this primary 3.. 6 months ago
xitter.cf/ATMSnipes/status/20470…
So rather confident..

Avery retweeted
I posted this on May 9th.. Almost 6 months ago.
From the forecast to the analysis in text.
It doesn't get more spot on.
"I also anticipate this distribution will take several months as we simply grind higher through summer and into mid terms before any real sell off"
Same HTF thesis for months..


$SPY Daily
As we approach 742-745 range, volatility should begin to return.
In other words, I am preparing for distribution to take place.
Truthfully I think as long as we remain above $700. There isn't much reason to expect significant downside at this time.
I also anticipate this distribution will take several months as we simply grind higher through summer and into mid terms before any real sell off
as always, time will tell but this is my plan until it fails
Regardless, its wise that you have your own plan as well.


$PLTR 2 months ago we nailed the ER move and called for $200.
This has now played out.
Going forward, We should see that earnings gap get tested down in the $140's over the next several months.
Haters in the comments called me a flip flopper. Mean while we played the new thesis multiple times and caught huge winning trades.
Don't be afraid to flip flop.
Its okay to be wrong, its not okay to stay wrong. You can't make money that way and the idiots will try to convince you staying wrong is better off.

$PLTR
Additional room into 159-163 before this likely takes a short breather.
Measured upside for this 3rd wave into 172 maybe 177
This will revisit 190's/200 before EOY.
Big win for us to start the week🛐


despite everyone trying to tell me I'm wrong in the comments.
Confidence remains high that this is the end to primary wave 3 & Primary wave 4 is setting up.
Same look to the end of 2021...


$NBIS This is why we don't marry a directional bias.
As new data is presented, we should consider that information and respond accordingly.
As many who have been around know.. I was bearish on NBIS back in August.. then earnings sent a face ripper back to all time high.
My reaction then was "I was wrong and this is probably going to $300".
2 months of new data is presented and I developed a new thesis suggesting we could still $100 and why.
The idiots on this platform will call it flip flopping.
The same people who say that are the ones getting bagged because they don't react to new data. They are bag holders, not traders.

$NBIS Impulse down from all time highs -> ABC up from the 150 lows, now bear flagging and flirting with a loss of the 50D EMA which flips momentum in sellers favor.
Unless earnings saves this at the end of the month...
structure still strongly suggests this will fade back into the 200DEMA at 181, then the 50W EMA at 169.
Confirm below the 50W EMA and tha fade continues down too $100 to complete the HTF correction and setup a really nice long term buy where both hands will be used when offered

we keep adding to our march 2027 puts.
This isn't a pull back incoming.
Its a correction and time will be king
$SPY Todays post is about how the bulls can survive to see one more high AND about how the top can be in.
This isn't about me being right either way, im just passing information along.
The most important note.
The Weekly count remains the same.
Regardless of whether the top is in now or we see one more high.. WE have been scaling into further dated $SPY puts & have cash ready to add if we see another high.
As for the meat and potatoes..
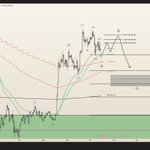
How the Buyers can survive: A possible running flat develops here (see image 1). Demand at 749-759 holds & buyers quickly rebid the 50D EMA and thrust into new ATH.
Measured targets would be 787, 797, 801 from there.
How the Sellers Take control: This wedge is complete and the look above prior ATH was all the market needed to complete this diagonal. (image 2)
Now the sellers need to continue to build price below the 50D EMA & there won't be much stopping this from fading into the 200D EMA.
As a trader you should know, nothing good happens below the 50D EMA & if buyers can't rebid that Moving Average. Look out below.
Again, i've been adding to $SPY puts for March of 2027. If things want flush now. Fine by me.. if the market wants to push for one more high.. fine by me, I'll buy more.
Regardless, I can't be bullish up here more than I am bearish
Enjoy the weekend lads


I post 5-10x as many charts per week & per month for just $10/Mo on my private feed
Im not perfect all the time but more times than not I'll lead you to the water
Click the link below to sign up
whop.com/market-dojo/standar…

$MSTR Once again, textbook corrective structure.
I expect a sweep of current OCT lows at a MINIMUM before we begin talking about a reversal higher..
50% retrace at 126.50 and the 61.8% has my attention at 115.50 before I anticipate some sort of bottom to begin forming.


$BTC As it was written.
Impulse down down into 72k - 75k should follow next and is what I expect to complete an ABC down and a mean reversion.
Keeping 69k in mind but we shall see if it offers..


$BTC More clarity now on this correction after a complete impulse down has printed for Wave A of C
expecting a relief rally back into 83.5k - 85.7k for Wave B of C
Wave C of C suggest continued downside into measured targets of 71.9k - 75k before this correction completes

Does this sound like the last 5 months to you?
FinX (or twit?) will try to tell you a top is in over the next several weeks and months.. They aren't wrong to some extent but there is a caveat.
if you aren't new to this you know damn well we will see multi week OR multi month distribution. tops aren't made in a single day and rarely in a single week.
so if you are trying to time a top now.. just know the market will try to mentally break you before the drop of any significance ever happens causing you to stop out.
Put option value will decay due to the time it takes to complete distribution. Breaking your will to hold.
We will see dips but won't fully reverse like what you're probably looking for. Once again, breaking you will to hold.
These failed breakdowns of significance will likely be followed by the market edging out a new ATH. Once again breaking your will to hold.
Then after this happens a few times. You'll be convinced it'll never breakdown and that's when you give up shorting...
often times, this is the worst time to finally get bullish again.
Just because its too high for you to want to buy.. doesn't mean your only choice is to short.
Patience for the right buy often is the better choice.
I posted this on May 9th.. Almost 6 months ago.
From the forecast to the analysis in text.
It doesn't get more spot on.
"I also anticipate this distribution will take several months as we simply grind higher through summer and into mid terms before any real sell off"
Same HTF thesis for months..
$SPY Daily
As we approach 742-745 range, volatility should begin to return.
In other words, I am preparing for distribution to take place.
Truthfully I think as long as we remain above $700. There isn't much reason to expect significant downside at this time.
I also anticipate this distribution will take several months as we simply grind higher through summer and into mid terms before any real sell off
as always, time will tell but this is my plan until it fails
Regardless, its wise that you have your own plan as well.
$PLTR Stretched beyond 203 and into 212 to complete this impulsive structure.
Earnings right around the corner but pops should continue to get sold here going forward as this fades into 172 and like the 200D EMA over the next several weeks


$PLTR Impulse up nearing completion.
could see 203 and then I would prepare for a corrective pull back to follow soon

$UCO $USO Back in February I warned before the war even started that oil could go parabolic.
This has been nothing short of a perfect call timing and forecast wise. On a 2X leveraged ETF that decays naturally.
we are at the point of no return and this is only going to get worse.


$SPY Todays post is about how the bulls can survive to see one more high AND about how the top can be in.
This isn't about me being right either way, im just passing information along.
The most important note.
The Weekly count remains the same.
Regardless of whether the top is in now or we see one more high.. WE have been scaling into further dated $SPY puts & have cash ready to add if we see another high.
As for the meat and potatoes..
How the Buyers can survive: A possible running flat develops here (see image 1). Demand at 749-759 holds & buyers quickly rebid the 50D EMA and thrust into new ATH.
Measured targets would be 787, 797, 801 from there.
How the Sellers Take control: This wedge is complete and the look above prior ATH was all the market needed to complete this diagonal. (image 2)
Now the sellers need to continue to build price below the 50D EMA & there won't be much stopping this from fading into the 200D EMA.
As a trader you should know, nothing good happens below the 50D EMA & if buyers can't rebid that Moving Average. Look out below.
Again, i've been adding to $SPY puts for March of 2027. If things want flush now. Fine by me.. if the market wants to push for one more high.. fine by me, I'll buy more.
Regardless, I can't be bullish up here more than I am bearish
Enjoy the weekend lads
$SPY Still seeing this as a rising wedge near these highs.
Just like the 2021 top.
We could still pop into 784-790 looking at the LTF structure and daily measured targets.
After that though, Primary wave 4 (red circle 4) is setup to begin developing into EOY and into/through 2027.
If this some how extends well into the 800's.. this weekly count doesn't invalidate as long as the intermediate wave 5 (blue (5)) doesn't go beyond 844.

$BTC More clarity now on this correction after a complete impulse down has printed for Wave A of C
expecting a relief rally back into 83.5k - 85.7k for Wave B of C
Wave C of C suggest continued downside into measured targets of 71.9k - 75k before this correction completes
$BTC The accuracy remains unmatched.
I warned Sept 21st that a W2 correction will follow in the coming weeks.
We are now seeing that correction take place.
There are two options.
1) This correction remains shallow and price will briefly lose the 50W EMA before reclaiming and building out a base for wave 3
Same scenario as 2023
2) A steep correction which is common for wave 2's and we get a fade back into 72,600 as they sweep September lows for liquidity before beginning the next wave higher.
For now, those with patience will be rewarded because this will likely take several weeks (few months) to develop
