

Data Analyst • Trainer & Educator • Helping you become job-ready in Data Analytics | SQL • Power BI • Python • Excel Sharing Interview Prep + Career Tips
New Delhi 🇮🇳
Joined December 2020
- Tweets2.7K
- Following993
- Followers1.3K
- Likes29.7K





Pinned Tweet
📊 Today I haveCreated a Pharmacy Sales & Payments dataset today.
Explore it on Kaggle and share your honest feedback. Your suggestions will help me improve it. 🙌
@kaggle
@KaggleDatasets
🔗 kaggle.com/datasets/akalyanb… – at New Delhi, India

Thank you @Delhiuniversit 🎓 for the opportunity to invite me as a Power BI Speaker at the National Seminar. Truly honoured & grateful to share my knowledge with such brilliant students. 🙏
@RLAC_DU
#DU #universitySeminar #DelhiUniversity #PowerBI #Speaker – at New Delhi, India


ADITYA KALYAN | DATA Engineer 🇮🇳 retweeted

Basic SQL Concept:
Do you know which SQL condition can correctly identify rows where a column contains NULL?
A) column = NULL
B) column == NULL
C) column IS NULL
D) column EQUALS NULL

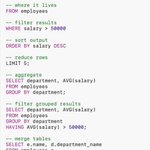
How To Aggregate Data In SQL
✅ COUNT = number of rows
✅ SUM = total values
✅ AVG = average value
✅ MIN = smallest value
✅ MAX = largest value
✅ GROUP BY = group results
✅ HAVING = filter groups
#SQL


ADITYA KALYAN | DATA Engineer 🇮🇳 retweeted

APPLIED → INTERVIEWED → HIRED
May it all happen for you before the end of this month.
6. Power Query → Combine and refresh files
7. Projects → Expense tracker, sales report, inventory list
8. Interview prep → Explain your method
Go back to the stage where you got stuck.
Your Excel roadmap, start to finish
1. Basics → Tables, sort, filter, formats
2. Core formulas → SUM, IF, COUNTIFS, SUMIFS
3. Lookups → XLOOKUP, INDEX + MATCH
4. Data cleaning → Spaces, dates, duplicates
5. Reporting → PivotTables and charts
🚀 Day 1 of 50 Days SQL Challenge.
Today : Introduction to SQL & Databases.
Learn the basics. Build strong foundations.
Master SQL one day at a time.
Follow @Adje_Analytics for more.
#SQL #SQLLearning #DataAnalytics #100DaysOfCode
SQL tips 💡 #Day6
DAY 6/50 — CASE WHEN
Build business logic directly in SQL. Categorize customers, classify sales and create meaningful segments.
Follow @Adje_Analytics for more.
#SQL #DataAnalytics #AdityaAnalytics
DATA FILE TYPES CHEAT SHEET
✅ .csv = raw data file
✅ .xlsx = Excel workbook
✅ .sql = saved query file
✅ .pbix = Power BI report
✅ .json = API data format
✅ .txt = plain text file
#SQL #DataScience #PowerBI
#json #dataAnalytics #tech #PowerBI #CSV
ADITYA KALYAN | DATA Engineer 🇮🇳 retweeted

Your Power BI dashboard might look professional but still be difficult to use.
Here are 5 dashboard mistakes you should avoid. 👇
ADITYA KALYAN | DATA Engineer 🇮🇳 retweeted
1. Using too many visuals on one page.
2. Choosing colours with poor contrast.
3. Displaying KPIs without context.
4. Using inconsistent number formats.
5. Ignoring the needs of the end user.
A good dashboard should communicate clearly, not just look attractive.

Share Your @github Profile and Let's Connect.
#Connect #SQL #DataAnalytics #PowerBi #Technology #developer #github #LetsConnect – at New Delhi, India

ADITYA KALYAN | DATA Engineer 🇮🇳 retweeted

STEPS TO BECOME A DATA ANALYST
1. Learn Excel
↓
2. Learn SQL
↓
3. Learn Power BI
↓
4. Learn to use AI
↓
5. Practise real-world projects
↓
6. Build a portfolio
↓
7. Apply for jobs
TOP DATA ANALYST TOOL :
✅ SQL + Python = automation powerhouse
✅ Excel + Power BI = business-friendly analysis
✅ Power Query + Power BI = clean pipelines
✅ SQL + Tableau = flexible visual stories
✅ Python + Jupyter = reproducible analysis
Your stack is your superpower.
