

The de facto standard for professional market data and infrastructure. 20+ years of tick history, real-time feeds, co-location and cloud SQL.
New York
Joined September 2020
- Tweets221
- Following87
- Followers114
- Likes12





Pinned Tweet
If you have studied US microstructure, you have probably touched our tape.
Equities from January 2007, OPRA, CME Globex. Every trade and quote, one file per symbol per day
We recorded it off the feed. Nothing here is inferred.
algoseek.com

Everyone watched the index Wednesday. But have you looked under it?
Best to worst S&P sector: 9.03 points. Discretionary +4.3%, energy -4.8%.
Widest single session of 2026. The median day this year is 3.16.
SPY closed up 1.7%. Energy and industrials fell, technology was flat.

Tickers get reused, so you keyed the backtest on CUSIP instead
A merger or reorganisation can require a new CUSIP. ISIN and FIGI carry their own versioning.
Each still needs a dated mapping to your prices. The date never stops being part of the key.
algoseek.com/blog/data-guide…

Market Breakdown - Week of 26 October
Seven-day vol against 90-day finished 5th highest of 36 full weeks, and the
Nasdaq future had its 2nd busiest week of the year.
EQUITIES
Volume came back to its 2026 average. The median stock quoted more per trade than
in any full week this year, though market-wide the same measure was only 8th.
Volume: $924B a day, -1% vs 2026
Trades: 113m a day, -7%
Quotes per trade, median stock: 19.1, 2026 avg 15.4
Off-exchange, median stock: 42%
Median stock: +0.2%, breadth 55%
OPTIONS
7-day vol against 90-day was the 5th highest of 36 full weeks this year.
30-day IV: 48, 2026 avg 45
Puts over calls: 2.4 vol pts
Names with puts richer: 67%
7-day vs 90-day IV: +5.0
Put/call open interest: 0.80
FUTURES
The Nasdaq had its 2nd busiest week of 2026, fed funds its 10th of 36 full weeks.
21 benchmark products: 16.7m a day, -5% vs 2026
Busiest against their own average: the Nasdaq +25%, fed funds +21%
Quietest: crude -33%, Brent -28%
Open interest: diesel -6% against last week's average
FUTURES OPTIONS
Rates hold 71% of all open interest once SOFR mid-curves and weekly Treasury
options are counted, and shed 4% on the week.
Open interest: 59.2m contracts, -10% vs 2026
Week on week: -5.2%
Put/call: 0.73
Equity index put/call: 2.10, down from 2.21


We are hiring!
We are looking for someone to run this account, help with marketing strategy and social media growth.
If you know how to grow on social media AND have financial knowledge, this role is for you.
Part time - Fully Remote (anywhere)
algoseek.com/career/part-tim…

The open interest in your options file is yesterday's number.
Vendors disagree about which date to stamp on it. Pick the wrong one and your filter is reading a figure no trader could have seen that morning.
A lookahead bug that never throws an error.
algoseek.com/blog/quantitati…

A futures price chart is a choice, not a fact.
The 2026 gold chart opens as February gold and ends as December gold. The four switches add 3.7% of price that no position lived through.
Charted that way gold is down 7%. The contracts lost 10%. The gap is carry, 5% a year.

Market Breakdown - Week of 19 October
One of the quietest weeks of the year on the tape, and the typical stock traded at the midpoint more than in any week so far in 2026.
EQUITIES
The 4th fewest trades of any week so far this year.
Volume: $843B a day, -10% vs 2026
Trades: 107m a day, -12%
Midpoint share, median stock: 28.2%, a 2026 high, avg 26.0%
Quotes per trade, median stock: 18.8, a 2026 high, avg 15.3
Off-exchange, median stock: 42%, avg 41%
Median stock: +0.8%, 59% of names up on the week
OPTIONS
Implied vol was joint 7th highest of 35 weeks this year.
30-day IV: 47, 2026 avg 45
Puts over calls: 2.2 vol pts, 2026 avg 2.3
Names with puts richer: 65%, avg 67%
7-day vs 90-day IV: +3.6, avg +1.8
Put/call open interest: 0.81, avg 0.82
FUTURES
The Nasdaq had its 3rd busiest week of 2026, the S&P its 9th.
21 benchmark contracts: 15.9m a day, -10% vs 2026
Busiest against their own average: the Nasdaq +18%, the S&P +14%
Quietest: silver -37%, diesel -29%
Open interest: fed funds +8% against last week's average
FUTURES OPTIONS
The October expiry took 6% off open interest over the weekend, and the week spent rebuilding it.
Open interest: 62.4m contracts, -5% vs 2026
Monday to Friday: +4.1%
Rates share: 70%, counting SOFR mid-curves
Put/call: 0.74
Equity index put/call: 2.21, below the 2.46 average for the year


What is a delisting return?
From a stock's last trade to its value after delisting. For failures, about -30% on NYSE/AMEX and -55% on Nasdaq
The 1993 CRSP files had one for 11.7% of NYSE/AMEX failures. Nasdaq: 0 of 3,750
What a backtest does without it
algoseek.com/blog/data-guide…

Market Breakdown - Week of 12 October
Seven-day vol against 90-day went from near the bottom of its 2026 range to the 4th highest of 34 weeks, in five sessions.
EQUITIES
Midpoint trading hit its highest of any week in 2026.
Volume: $893B a day, -5% vs 2026
Trades: 112m a day, -8%
Midpoint share, median stock: 27.7%, 2026 avg 25.9%
Quotes per trade, median stock: 18.3, 2026 avg 15.2
Off-exchange, median stock: 42%
Median stock: -0.2%, breadth 46%
OPTIONS
7-day vol against 90-day was the 4th highest of 34 weeks this year. Last week it was the 6th lowest.
30-day IV: 47, 2026 avg 45
Puts over calls: 1.7 vol pts
Names with puts richer: 64%
7-day vs 90-day IV: +5.3
Put/call open interest: 0.79
FUTURES
Fed funds had its 4th busiest week of 2026, natural gas its 8th.
21 benchmark contracts: 17.5m a day, -1% vs 2026
Busiest against their own average: fed funds +45%, natural gas +20%
Quietest: silver -40%, Brent -30%
Open interest: fed funds the biggest percentage mover, +9% on the week
FUTURES OPTIONS
Rates hold 71% of all open interest once SOFR mid-curves are counted, and grew 4% on the week.
Open interest: 64.0m contracts, -3% vs 2026
Week on week: +3.8%
Put/call: 0.72
Equity index put/call: 2.09


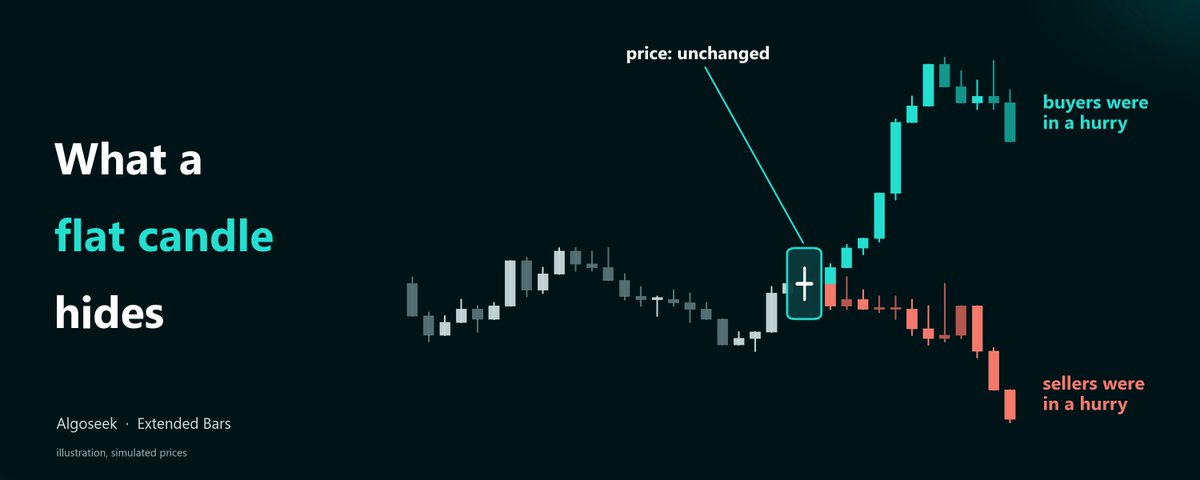
Everyone knows high quality data is important.
But do you know exactly what you miss out by trading only flat candles?
How this can even cause you to make untradable backtests, and lose money live.
It's all in here.
BREAKING: The S&P 500 ETF is up 13.9% in 2026. The median US stock is up 2.7%.
Only 32% of 3,821 names beat it.
An index at a high is not a market at a high.

Market Breakdown - Week of 5 October
A quiet week almost everywhere, and puts kept shrinking as a share of open interest.
EQUITIES
The tape printed its 3rd fewest trades of any week in 2026.
Volume: $835B a day, -11% vs 2026
Trades: 107m a day, -13%
Quotes per trade, median stock: 17.9, avg 15.1
Off-exchange, median stock: 43%
Median stock: flat, breadth 52%
OPTIONS
Short-dated vol against 3-month was the 6th lowest of 33 weeks this year.
30-day IV: 45, avg 45
Puts over calls: 1.4 vol pts
Names with puts richer: 62%
7-day vs 90-day IV: -1.4
Put/call open interest: 0.78, a 2026 low
FUTURES
Natural gas had its 10th busiest week of 2026, the ultra 10-year its 9th.
21 benchmark contracts: 14.6m a day, -17% vs 2026
Busiest against their own average: natural gas +10%, the ultra 10-year +1%
Quietest: silver -43%, fed funds -39%
Open interest: fed funds the big mover, -7% on the week
FUTURES OPTIONS
Puts are the smallest share of open interest of any week in 2026.
Open interest: 61.7m contracts, -6% vs 2026
Week on week: +5.1%
Put/call: 0.71
Equity index put/call: 1.99
Rates options: 59% of all open interest, +5% on the week


Some of the short-horizon mean reversion quants measure is the bid-ask spread
A round trip crosses it twice, dragging the variance ratio below 1. Reversion nobody can trade
We ship the quotes. Rerun it on the mid
Here are the data checks that catch it
algoseek.com/blog/mean-rever…


