

Options income trader. Selling puts & calls for premium while waiting for better prices. Trade receipts, $SPY levels, market breadth & AI. NFA.
xWallStreet
Joined February 2010
- Tweets12.2K
- Following647
- Followers2.5K
- Likes2.2K


Pinned Tweet
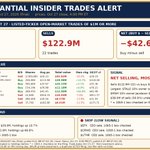
October P/L +7%.
+$4,244 in premiums collected.
About $80k of buying power used.
Cash-secured puts and calls.
Not a new strategy.
The same rule:
sell only at a price we’d own.
Not every month looks like this.
The point is the rent, not the screenshot.
Focus on process, capital preservation, and compounding. Everything else is noise.
9-month scorecard vs the indexes (Feb–Oct 2026):
Portfolio: +63.02%
$SPY : +10.73%
Dow: +7.71%
$NDAQ : +9.44%
Monthly comparison vs SPY:
• Feb: +1.0% vs SPY -0.6%
• Mar: +3.2% vs SPY -4.3%
• Apr: +3.2% vs SPY +10.0%
• May: +5.7% vs SPY +4.8%
• Jun: +5.0% vs SPY -1.1%
• Jul: +5.7% vs SPY +0.2%
• August: +11.65% vs SPY +2.6%
• September: +8.07% vs SPY -.5%
• October: +7.07% vs SPY -1%
Fear Is Back Above Nineteen
$VIXY up 12.91% on Friday after touching 21.08 intraday.
That is a jump, not a drift the week's calm (16.91 on Wednesday) is gone, and the market goes into a midterm weekend pricing real two-way risk.
The tone changes again if the VIX holds above 20 into Monday's open; a fade back under 18 would say Friday was capitulation, not the start of something.
$SPY trend check
SPY closed Friday at $755.81
• 50-day $767.63: below by $11.82, about 1.5%. SPY lost the 50-day on Friday.❌
• 200-day $725.23: above by $30.58, about 4.2%.✅
• 50-day above 200-day: golden cross intact.✅
Today’s sold puts/calls/trades (+$435 premiums on free margin)
Delta Avg: .21
Beta Avg: 1.7
$ASST
$HIMS
$NKE
Different industries, different demand drivers, different risk cycles.
That’s the point, sector diversification means one weak industry doesn’t tank the entire stream.
Spread the risk, keep collecting.

Paid to Take the Print, at My Price
I'm selling the Hims & Hers Nov 13 $22.50 put at $0.40 — one contract, and the earnings report is inside this trade on purpose.
17.9% of cushion even after today's drop, 14 days, APY 46.3% on strike / 393.5% on margin.
$HIMS is trading about $27.41 after falling about 7.6% today and about 40% in a year.
At $22.50, the stock has to fall about another 18% from here — after today's drop — before my put is touched. If the print goes badly enough to get there, my basis is $22.10 on a profitable, subscription-based telehealth business whose customers reorder medication and care monthly, not once.
Expire worthless, I keep the $39.34 net credit. Assigned, I bought at $22.10, a price I chose while the stock traded $27.41. The strike is the view.
Own Nike at the Low, or Get Paid Not To
I'm selling the Nike Nov 20 $33 put, sell to open, for a $10.34 credit.
15.1% of cushion, 21 days, APY 52.8% on margin on that credit, and it expires almost a month before the Dec 17 earnings.
$NKE is trading about $38.87, down about 40% in a year from a $70.44 high — a great company the market has already punished for its China and guidance problems. In the last month it has climbed about 11% and taken back its $36.97 50-day, so I'm selling into a bounce that has stabilized, not into the first leg of the fall.
The $33 strike is the whole argument. It sits about 15% below the price and just above the $31.97 52-week low. If I'm assigned, my basis is $32.90 — about 3% above the low, at about 15.7x trailing earnings, on the strongest brand in its category, with a restructuring program targeting about $2.5B in savings behind it.
The calendar helps too: Nov 20 expires well before the Dec 17 earnings report, so I'm collecting the volatility in a beaten-down name without carrying the put through its print.
Expire worthless, I keep the credit. Assigned, I own Nike essentially at its yearly low, at a price I picked while it traded $38.87. The strike is the view.
Peter Lynch Score: $M 6/10
Peter Lynch averaged 29% a year for 13 straight years. Below we run securities through his eyes.
Macy’s runs department stores. Raised full-year EPS guidance to $2.15–$2.35.
Market cap $6.5B. Price $24.70.
Near the $26.60 high.
Up 25% over the year.
Cash is real.
Lynch buy price going forward: $18-20 or lower.
That is closer to 6–7× earnings and under 4× free cash flow. Conservative fair $16–$20.
Technicals:
Resistance $25.50–$26, then $26.60. Support $22.50–$23, then the 50-day at $22.70 and the 200-day at $21.60.
Price is above both. RSI neutral.
Optimal put to sell: 30–60 day $20 strike.
Do not write $22 or $23. Assignment only makes sense at the buy line.
🚨 52-Week High Tape 🚨
NYSE new 52-week highs jumped 32.7%, from 110 to 146, on a day the Nasdaq fell 1.37%
Lows still lead: 201 on the NYSE and 191 on the Nasdaq, where lows beat highs about 2.2 to 1. But the gap narrowed on both exchanges, and the Russell 2000 rose 1.01%
New highs on heavy volume:
$OSW (2.79x volume, first new high in 87 sessions),
$ADUS (1.77x, first in 246 sessions),
$SN (2.07x, +5.5% day).
My read: the selling stayed in big tech while breadth under the surface improved. That looks like rotation, not a breakdown, until the lows start climbing again.
Are you watching small caps here, or waiting for Nasdaq highs to come back first?

$AMZN at the $160–$180 level is where put selling starts to make sense.
That is the zone where assignment is intentional, not accidental.
Above that, the premium is just paying you to hope it does not fall further.
We only sell puts at a price we would own.
$160–$180 (and lower) is that price for $AMZN.
Higher is not.

Fell Into the Print, Then Fell More
$AMZN
Why: Down 4.25% in the regular session ahead of its own print, then down about 6% more after hours — the market sold Amazon twice in one day.
Trends/fundamentals:
Negative — whatever the print held, the after-hours reaction says the AWS and spending bar was higher than the number.
Positive — the $496 billion AWS backlog story is still intact into Friday's read-through.
Peter Lynch Score: $GOOG 5/10
Peter Lynch averaged 29% a year for 13 straight years. Below we run securities through his eyes.
Alphabet runs Search, YouTube, and Cloud. Q3 revenue $127.6B, up 25%. Cloud revenue $30.7B, up 103%.
Q3 free cash flow was negative $9.1B. Capex $51B in the quarter. 2026 guidance still $195–205B. Management said 2027 will be higher. TTM free cash flow has collapsed to roughly $20B. Price $282, down 12% on the print. Market cap still $3.5T.
Lynch buy price going forward: $220 or lower.
That is closer to 11–12× trailing earnings. Conservative fair $200–$240.
Technicals: resistance $300–$310, then the 50-day near $337 and the 200-day near $339.
Support $278, then the 52-week low near $268. Price is below both long averages. Death cross formed. Do not confuse $282 with a buy ticket.
Optimal put to sell: 30–60 day $220 strike. Do not write $250 or $260. Assignment only makes sense at the buy line. A put above $220 is how you get handed a company that is currently spending more cash than it generates.
Under $200 is optimal buying opportunity.


The Last Data of the Week, Then Oil Majors
Friday's movers
1. Employment Cost Index, Q3, 8:30 a.m. ET, estimated up 0.8% quarter over quarter vs 0.9% prior — the Fed's preferred wage gauge, and the last labor-cost read before the December debate hardens.
2. Chicago PMI, 9:45 a.m. ET, forecast 54.8 vs 58.8 — a sharp expected cooling in Midwest manufacturing that would confirm the slowdown story if it prints soft.
3. $XOM and $CVX before the open — the oil majors report into crude near $100, with the whole energy tape watching whether they defend buybacks at these prices.
🚨Economic Calendar Week Ahead 🚨
Wed: FOMC decision 2:00p (target 3.75 to 4.00%, 94 of 100 economists expect a hold) and Warsh press conference 2:30p.
$GOOG and $MSFT after the close.
Thu: 8:30a GDP Q3 advance (prior 2.2%), PCE (prior +0.3% m/m), core PCE (prior +0.2% m/m) and jobless claims (prior 194K).
$AMZN, $INTC & $COIN after the close.

Fell Into the Print, Then Fell More
$AMZN
Why: Down 4.25% in the regular session ahead of its own print, then down about 6% more after hours — the market sold Amazon twice in one day.
Trends/fundamentals:
Negative — whatever the print held, the after-hours reaction says the AWS and spending bar was higher than the number.
Positive — the $496 billion AWS backlog story is still intact into Friday's read-through.
$SPY trend check
Closed Thursday at $769.36, down 0.38%.
• 50-day $767.63: above by $1.73, about 0.2%. The cushion above the 50-day is now razor-thin.✅
• 200-day $724.81: above by $44.55, about 6.2%.✅
• 50-day above 200-day: golden cross intact. ✅
Fear Ticks Up, But Nobody Panics Yet
$VIXY up 1.71% from Wednesday's 16.91 close, after trading a 16.21 to 17.36 range.
The first uptick in four sessions, and a small one, the market is nervous about Friday's data and the overnight earnings damage, not scared.
The tone changes if the VIX pushes back above 20 on a hot ECI print or another mega-cap guide-down.
9 OF 11 SECTORS ROSE TODAY. THE S&P 500 STILL FELL.
$SPY -0.30% | Nasdaq 100 -1.38% | Russell 2000 +1.01%
Green (9):
$XLV Health Care +2.40%
$XLRE Real Estate +2.21%
$XLP Staples +1.54%
$XLU Utilities +1.53%
$XLF Financials +1.44%
$XLB Materials +1.29%
$XLI Industrials +0.97%
$XLY Discretionary +0.75%
$XLE Energy +0.38%
Red (2):
$XLC Communication -1.87%
$XLK Tech -1.18%
$VIX 17.20 (+1.71%)
My read: the four best sectors were all defensive, and the only two losers are where most of the index's mega caps sit. Breadth was broad, but the heaviest weights went the other way. Small caps beat the Nasdaq 100 by 2.4 points.
Is this a rotation you trust, or just mega caps taking a day off?
Work toward the day you stop watching the market and only watch your portfolio.
The job is managing risk inside the book.
What is happening outside it is noise until it becomes a signal that forces you to act.
You do not need every headline.
You need the price where you would own the name and the size you can live with if you get it.
Everything else can wait.
Today’s sold puts/calls/trades (+$380 income on free margin)
Delta Avg: .10
Beta Avg: 1.27
$NVO
$M
$CAG
$F
$CHWY
$NCLH
Different industries, different demand drivers, different risk cycles.
That’s the point, sector diversification means one weak industry doesn’t tank the entire stream.
Spread the risk, keep collecting. No AI trades!

Same Strike, New Information
I'm selling the $F Nov 13 $11 put at $0.052
10.5% of cushion, 15 days, APY 11.5% on strike / 103.4% on margin
Before the print, $11 was a price I was willing to own Ford at through uncertainty. After it, I have the facts: adjusted EPS of $0.49 against $0.41 expected, revenue ahead of estimates, full-year EBIT guidance raised to $10.5B-$11B, and a stock that answered by rising to about $12.29. The strike didn't need to move. The confidence did.
At $11, the shares have to fall about 10.5% in 15 days to reach me — and if they do, my basis is $10.95, below the $11.11 52-week low
The caution in the print was 2027 costs, not 2026 cash and a Nov 13 expiry never gets there. The next earnings report is in February.
After the Beat, Sell the Higher Strike
I'm selling the $NCLH Nov 27 $15 put at $0.13 after the earnings, not before them.
18.1% of cushion, 29 days, APY 10.9% on strike / 100.4% on margin. No earnings before expiry, the print is already behind it.
This morning $NCLH reported adjusted EPS of $1.12 against $0.93 expected, revenue of $2.95B against $2.88B expected, and raised its full-year outlook to about $1.70 a share.
At $15, I'm offering to buy about 18% below today's price, at about 8.8x the raised full-year guide. My basis if assigned is $14.87.
And the calendar is clean now. The next print is months away, so the 29 days to Nov 27 carry no earnings gamble just a beaten-down cyclical, down about 18% in a year even after today's pop, that has to fall almost a fifth before my strike is touched.
Expire worthless, I keep the premium. Assigned, I add to a position I already own, below my original cost, after the company beat and raised. The strike is the view.