Tracking the Late Cycle Macro | Capital Rotation | Hard Assets Long-Term Positioning Not financial advice
Joined March 2020
- Tweets2K
- Following139
- Followers3.7K
- Likes835





Pinned Tweet
Gold vs. Stocks may be entering a regime change.
The $Gold / $SPX ratio has spent decades below a secular resistance line that connects the 1980 and 2011 peaks.
Now, for the first time in years, the ratio is pressing against it again.
A breakout could mark the beginning of a major capital shift toward hard assets.
If this resistance breaks, are your portfolios prepared for that kind of shift?

🇧🇷 Brazil vs. S&P 500 — The Great Rotation Setup
$EWZ / $SPX has broken above its secular resistance trendline dating back to 2009.
But Brazil still needs to reclaim the 4-year EMA and break above 0.0059 to confirm a sustained shift in relative strength.
One breakout is a start. Three technical barriers need to be cleared.
Will Brazil finally outperform U.S. equities in the next commodities bull market?

🇧🇷 $EWZ: A potential multi-year commodities bull market?
Brazil’s long-term resistance is being tested.
A breakout and hold above $48 would provide bullish confirmation. The BRL/USD chart is approaching its own key resistance at 0.2120.
Two levels to watch. One potential shift in market leadership.
But confirmation first.


🇧🇷 #Brazil is on my radar.
With presidential elections taking place today, $EWZ is approaching a potential structural breakout.
If the commodities bull market accelerates, could Latin America become one of its biggest beneficiaries?
My new article explores the setup, key levels, and what I need to see before allocating capital.
Full analysis in the first comment.
🤖 Made with AI
$3,500 and below? That’s where many see $GOLD heading next.
My view hasn’t changed: I believe we may have already seen a local bottom this summer, and the market is now retesting that low.
Gold often experiences seasonal weakness in Q4. This retest could be part of the process before the next move higher.
My targets remain at least $4,800, with a potential retest of the January high within the next 1–2 quarters.
Only after that could we see a deeper correction toward $3,500–$3,000, possibly closer to 2028.
Time will tell who’s right.
Not financial advice.
$XAUUSD

For long-term investors, $Silver is in a good accumulation zone. The January peak was a local high. The bigger move comes after the base is built. Not investment advice.


$Silver is still building a base after its January ATH. The $80–93 zone remains the major resistance. A sustained breakout is needed to signal a resumption of the bull trend. Until then, consolidation remains the base case. Patience over chasing.

The case for an equity correction into year-end is building.
Narrow market breadth, elevated oil prices, and tightening financial conditions could challenge the usual Q4 seasonal strength.
2018 is a reminder that the year-end rally doesn’t always come. History doesn’t repeat, but I’m watching closely.
#SPX #SPY

What I’m Watching Into Year-End. Four charts. Four key levels. One market map.
$SPX — local trendline and 4-year EMA.
$Brent — the $100 level.
$Gold — support, then $4,730–4,840 resistance.
$Silver — 45-year breakout support and a potential multi-year base.
Not a forecast. Just the levels that would confirm or change my view.
Full analysis in the first comment.
🤖 Made with AI

$BRENT | Daily Update
$120 this week? Still on the map.
$100 held. Price is at $110. The path is unchanged: $120 first, then the $126–140 zone.
Not investment advice.

$BRENT | Daily Update
Held the line. $100 was the level that had to hold. It did. Price is now back above $104, off the apex of the triangle.
Map is unchanged: $120 first, then the $126–140 zone — the 2008 monthly ceiling. As long as $100 stays support, the scenario is intact.
Not investment advice.
#oil

$SILVER | Daily Update
The retest is here.
Last update mapped the path lower — first $63, then the 45-year breakout line. Price is on that line now, $56.85. A monthly close below it turns the breakout into resistance. Hold it, and this is still the handle of the cup, not a failed one. $63 and $67.7–70 are the first levels back up.
The Jan 29 ATH at $121.5 can stay the reference for years. Basing continues. The base just got deeper.
Not investment advice.

$SILVER | Daily Update
$63 did not hold. Price is now on the 45-year breakout line, around $60. That is the level that matters on a monthly close — not the daily swing that just failed.
The nearer map is done. $67.7–70 and the 200D EMA are resistance again. $88–94 is not the next stop from here.
The bigger read is unchanged. The Jan 29 ATH at $121.5 can stay the reference for years. This still looks like basing, not the next vertical leg.
Not investment advice.


What if rising energy prices become the next headwind for equities?
$XLE is approaching secular resistance. A breakout could add to inflationary pressure just as the stock market faces growing correction risk.
Higher energy costs. Sticky inflation. Less room for the Fed to ease. A 20% correction in equities over the coming months is a scenario I’m watching closely.

Same president. Same midterm setup.
$NVDA in 2026 looks strikingly similar to 2018. History doesn’t repeat exactly, but the pattern is worth watching.
Could $140 be the next downside target?

$DXY — A Strategic Inflection Point
A long-term structure dating back to 2008 is approaching its decisive moment.
A breakout above descending resistance could signal renewed dollar strength and tighter financial conditions.
A breakdown below secular support could accelerate capital rotation toward gold and commodities.
One structure. Two very different macro outcomes. The next move matters far beyond the dollar itself.

$GOLD | Daily Update
Base case: a bottom is forming here. A higher low against the summer low, sitting on the $3,930–4,025 support zone.
The Sep/Oct seasonality thesis is still intact as long as that zone holds. The path higher is still open. It just needs the support to do the work.
Not investment advice.

$GOLD | Daily Update
The base case did not hold.
$4,380 and the 200D EMA failed. Price is now sitting on $4,200, with the $3,930–4,025 support zone underneath.
The higher-low thesis in Sep/Oct is still alive but only while that support zone holds. Lose it, and the scenario is done. Hold it, and this is still a pullback inside the structure, not a break of it.
Not investment advice.

Silver #miners vs. $Silver: $PAAS is still struggling to break the long-term downtrend.
0.86 remains the key resistance. A breakout could open the way toward 1.12.
Until then, the ratio may retest rising support or fall toward deeper support.
I’m watching the ratio, not just the price of silver. Miners still need to prove they can outperform the metal.

$Silver miners vs. the S&P 500: a multi-decade chart.
Since the 1968 peak, $HL has lost ~99.9% of its relative value against the S&P 500.
The ratio may be building a long-term base, but the breakout is still ahead.
0.0090 is the first major upside target in a potential commodities bull cycle. The upper resistance zone could become a much longer-term target.
Arrows illustrate a possible path, not a forecast.
The question is whether silver #miners are finally ready to turn the tide.

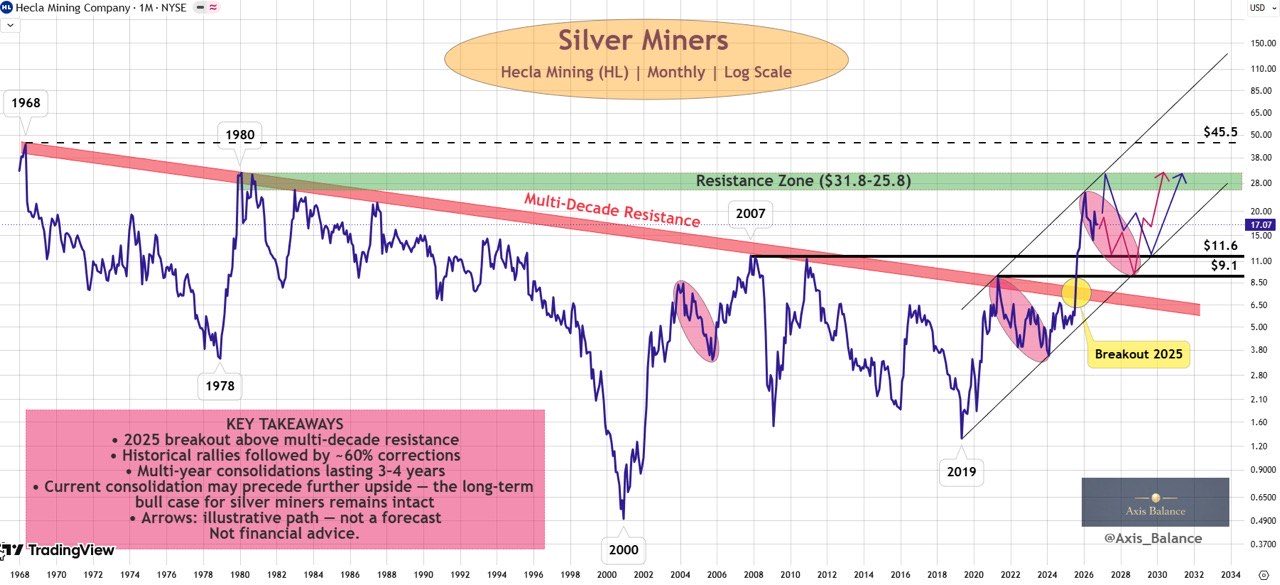
$HL has broken out of a multi-decade resistance structure. But does that mean silver #miners are ready to outperform?
Personally, I expect a correction or prolonged consolidation in miners, similar to what I expect from silver itself after its recent rally.
I compare the long-term price structure with relative-strength charts against the S&P 500 and $Silver itself.
The breakout is real. The confirmation is still missing.
Full analysis in the first comment.