

Unlocking the future of Bitcoin through Astrology & WD Gann's legendary methods | Technical Analysis & Crypto Price Predictions | Join me for daily insights!
Jupiter
Joined November 2020
- Tweets5.4K
- Following330
- Followers11.7K
- Likes8.8K




Pinned Tweet
The Second Edition of Harmonic Trading Matrix is now ready.
It’s an expanded and deepened edition, with new methods, refined calculations, and additional insights into cycles, geometry, planetary timing, and the Square of 9.
To mark the release, I’m offering a 20% discount until the end of January.
After that, the price will increase, as the system is now more complete than ever.
If you’ve been following my work and wanted to learn the full framework behind the pivots, this is the best time.
Message if interested


#Bitcoin
BTC Planetary Movements & Outlook for the Coming Weeks
patreon.com/BitcoinAstro/pos…

#BTC Short-term support has broken.
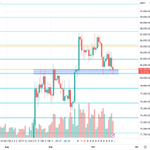
On the lower timeframes, BTC has lost the important $80,700–$81,300 support zone, which now may become resistance.
Bulls need to reclaim this area to regain short-term momentum.
Until then, the structure remains weak, with $78,400–$78,500 the next major support to watch.
A successful reclaim could trigger a recovery towards $82,100–$82,600.
Previous support becomes resistance until proven otherwise.
Watch the levels, not the emotions.

Bitcoin Astrology retweeted

$BTC Market Update Video
Today Friday Oct 23rd
Please adjust speed to 1.5x
$ZEC Price, Vibration & the Universal Laws of Mathematics.
The mathematical formulas I use to calculate price levels are working like a charm on #ZEC!
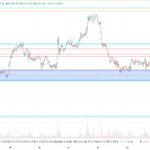
Just look at the chart. Price repeatedly reacts around these calculated levels, creating remarkably precise areas of support, resistance, and potential reversals.
Nothing here is drawn randomly. Every horizontal line is derived from mathematical calculations involving square roots, harmonic ratios, and musical vibrations.
The same mathematical principles that govern sound, frequency, geometry, and natural cycles can also be explored in financial markets.
Price is vibration. Markets move through mathematical relationships.
This is the foundation of W.D. Gann's philosophy and a major part of my own research.
What you're seeing is just a small fraction of the 20+ methods I cover in my Harmonic Trading Matrix book/course, where I explain how to calculate these levels, identify confluences, and combine price with time.
Once you begin studying these relationships, you may never look at a price chart the same way again.
Everything is connected through mathematics, time, and vibration.
#ZEC #Gann #HarmonicTrading #Trading

#Bitcoin
NEXT POTENTIAL TURNING POINT IN HOURS!
This chart has already been shared with my Patreon and Telegram members.
Using my HTM TradingView indicator, I've identified the next potential turning-point window on the 4H chart, with two important candles coming up:
🎯 20:00 and 00:00
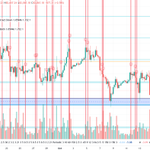
Look closely at the red vertical lines and how many of them coincide with significant short-term highs, lows and reversals.
BTC has just experienced another rejection, and price is now approaching an important support zone around $80,700–$81,200.
Will these upcoming time windows mark a local low and reversal, or will we see further downside?
TIME gives us the window. PRICE and STRUCTURE will confirm the direction.
The beauty of this indicator is that these potential turning points are calculated in advance, not after the move has happened.
If you want to follow these turning points in real time, alongside my planetary cycles, Gann calculations and market forecasts, join my Patreon or Telegram group.

#Bitcoin
BEFORE & AFTER! TIME + PRICE + GEOMETRY
Take a close look at these two charts.
The first chart was shared 4–5 days ago, with a potential reversal area already projected and marked with a red ellipse.
The second chart shows what happened afterwards.
Surprisingly… or perhaps not so surprisingly 😉, BTC rallied straight into that projected area around October 21, near $85k, and was rejected almost exactly where expected!
Not just the price level, but the timing and geometric resistance lined up beautifully.
This is exactly why I always emphasise the relationship between TIME, PRICE and GEOMETRY. When several independent calculations point towards the same area, it becomes a level worth paying attention to.
Now, what's next?
The critical support levels remain $81,200 and $80,700. As long as these hold, another attempt higher is still possible.
However, a confirmed break below this support zone would weaken the short-term structure and increase the probability of further downside.
On the upside, $84,210 remain important levels to reclaim.
Remember, the original chart was shared BEFORE price reached the projected area, not drawn afterwards.
TIME tells us WHEN. PRICE tells us WHERE. STRUCTURE confirms WHAT happens next.
That's the power of combining Gann, geometry and time-cycle analysis.


#BTC October turning points.
I receive messages almost every day asking when the next Bitcoin turning point is.
Normally, I don't share all my dates in advance on X because my full forecasts, price levels and calculations are reserved for Patreon and Telegram members.
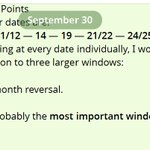
But today, I'll make an exception and share ALL my October dates, originally published on September 30th, so everyone can see how they've played out so far.
October turning points:
2 — 4/5 — 8 — 11/12 — 14 — 19 — 21/22 — 24/25 — 28/30
Now compare those dates with the BTC chart below.
🔹 October 2–4: Major highs, followed by a significant decline.
🔹 October 8: Important low, followed by a recovery.
🔹 October 11/12: Local high and another change in short-term direction.
🔹 October 14: Another turning point as BTC continued testing the support area.
🔹 October 19: Another date to watch, with price currently trading near a critical support zone.
Not every date produces a major reversal, and not every turning point is equally important. Some mark highs, others lows, while some produce smaller reactions or continuation moves.
The important thing is that these dates were calculated and shared BEFORE the market reached them.
And remember, these are only the timing calculations. When TIME aligns with my calculated PRICE levels, the setup becomes even more interesting. This is what Gann referred to as price and time squaring out.
Now, the bigger picture:
Bitcoin is sitting at a major support area around $80,700–$81,200.
This is not just another minor level. How BTC reacts here could help determine the price action for the next several months.
Holding this zone keeps the possibility of another bullish move alive. Losing it, particularly with a confirmed break below $78,400, would seriously weaken the bullish structure and strengthen the case that the Q4 high is already behind us.
I already have my preferred scenario based on multiple independent calculations, but my bias is not confirmation. The market must confirm it through price action.
The remaining October dates to watch are 21/22, 24/25 and 28/30.
If you want my complete monthly reports, major turning-point windows, exact price levels, detailed market scenarios and ongoing updates, everything is available through my Patreon and private Telegram community.


#BITCOIN
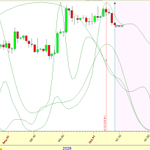
Take a close look at this chart.
The green line represents one of my planetary movement cycles, plotted directly against BTC price.
Notice how closely some of the major highs, lows and changes in trend have aligned with the turning points of this cycle.
And look at what's happening now.
The planetary cycle has just formed a potential high and has turned lower.
The real questions now are:
WHEN is this dump likely to end or has it ended?
WHERE could BTC find its next important support and resistance?
And is this just a correction, or the beginning of something much bigger?
I already have my next important timing windows, potential price targets and different scenarios mapped out.
If you want more than just occasional public updates, join my Patreon or Telegram group, where I share detailed BTC forecasts, planetary cycles, Gann analysis, key turning-point dates, support/resistance levels and regular market updates.

$BTC
My HTM Time Pivots Indicator may only be available until the end of October!
Due to changes in TradingView's policies, I may have to stop accepting new users. Anyone who already has access will keep it for LIFE.
Take a look at the BTC 4H chart below.
The red vertical lines are calculated in advance using my proprietary TIME-cycle methods. Notice how frequently they align with important highs, lows and short-term reversals.
The next potential turning point on the 4H chart is 17 October at 09:00 UTC.
The indicator works on ANY asset and timeframe, calculates future turning points automatically and allows you to backtest historical cycles.
No complicated calculations required!
$299 one-time payment, lifetime access.
This may be your last opportunity to get it before access for new users closes.


#Bitcoin
Bulls are still in control, but there are two levels they MUST defend.
Despite the recent pullback, Bitcoin's market structure remains bullish. Price is still holding above previous resistance turned support and, importantly, above Gann's 1x1 angle, which has been acting as a key dividing line between bullish and bearish structure.
However, there are two critical levels I'm watching:
$80,500 - First major support
$78,400 - Second key level bulls must defend
As long as these levels hold, the bullish scenario remains valid, and another move towards new highs is still possible.
But if BTC loses these supports, or fails to establish new highs within the next 2–4 weeks, it would significantly strengthen the case that the Q4 high is already in. A confirmed breakdown would provide stronger evidence.
I already have my preferred scenario based on my TIME cycles, planetary calculations and other methods. But having a bias and having confirmation are two completely different things.
The next few weeks could be decisive.
For those who want to go deeper, I share my full BTC market reports, important turning-point dates calculated in advance, key price levels, support and resistance, and detailed market scenarios on Patreon and in my private Telegram group.
These aren't simply bullish or bearish predictions. I explain what I'm watching, why certain dates and levels matter, and what would confirm or invalidate each scenario.
Don't just react to the market. Prepare for the possibilities before they unfold.


#Bitcoin IMPORTANT PIVOT WEEK!
According to my TradingView indicator, we are entering another important turning point window on the WEEKLY chart.
Look at the chart closely.
The red vertical lines are potential pivot dates calculated automatically by my indicator, using mathematical relationships and time cycles.
Notice how many of these windows have coincided with significant BTC highs, lows and changes in trend throughout the past few years.
Now we're approaching another one.
Does this mean BTC has to reverse lower? Not necessarily. A pivot can mark a high, a low or an acceleration in the existing trend.
The beauty of this indicator is that these dates are calculated in advance, not drawn after the market has already moved.
TIME tells us WHEN. PRICE tells us WHERE. STRUCTURE confirms the direction.
And remember, this is the WEEKLY chart. We're not talking about a small intraday move, but a potentially significant turning point.
Let's see what the market delivers.

$BTC #bitcoin
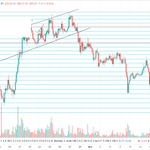
I've marked my turning point dates since mid September on the chart below. Take a close look at how many significant highs and lows formed around those dates.
But there's something even more interesting, on almost every occasion, price also reached one of my calculated price levels right around the pivot date.
This is what Gann referred to as PRICE and TIME squaring out, when the two come together at an important market turning point.
Do I get everything right? Absolutely not. Sometimes I expect a high and get a low, or vice versa. I'm always open about my mistakes.
But there's a big difference between predicting WHEN the market may turn and predicting WHICH direction it will take.
The accuracy of these timing windows, especially when combined with the price levels, speaks for itself.
And it's not just about short term pivots.
Three of my most important windows, shared months in advance (some at the beginning of the year), were:
15–21 August - The breakout
31 August–4 September - The first major high
23–30 September - The second major high
These dates weren't selected after the moves. They were calculated and shared long before the market reached them.
I have tremendous respect for other analysts and their work, but I rarely come across this level of consistency in identifying major turning point windows so far in advance, particularly when both TIME and PRICE align.
I'm not claiming to know every move or to be right every time. My directional expectations can be wrong, and when market structure disagrees, I adjust.
But I've spent years researching and developing these methods, and I believe the results deserve attention.
Next important turning points: 11/12 and 14 October.
The remaining dates, price levels and detailed roadmap are shared with my Patreon and Telegram members.
TIME tells us WHEN. PRICE tells us WHERE. STRUCTURE confirms the direction.
That's the foundation of my entire methodology.

Bitcoin Astrology retweeted
#Bitcoin #Gold
⚠️ IMPORTANT: This indicator may not be available to new users for much longer.
Due to upcoming TradingView policy changes, I may have to stop offering access to new members. Anyone who already has access will keep it for lifetime.
The indicator takes several of my most important TIME cycles and calculations and automatically plots the next potential market turning points directly on your chart.
Any asset
Any timeframe
Forward & backward cycles
Potential turning points calculated in advance
Cycle confluences highlighted automatically
No complicated calculations required- choose your starting point and let the indicator map the cycles.
$299 - lifetime access.
Once access for new users closes, I can't guarantee I'll be able to offer it again. Existing users keep theirs.


