

Access Bitcoin metrics, daily updated, full historic data, unlimited alerts, data downloads... 100% FREE
On Chain
Joined May 2021
- Tweets20
- Following27
- Followers3.5K
- Likes38

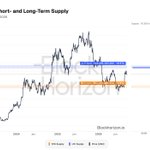




🚨 5 new Bitcoin charts are now live on BlockHorizon, all completely free:
• Cost Basis Heatmap
• Realized Cap HODL Waves
• Coin Vintages
• HODL Waves
• Cushion Depth Fan


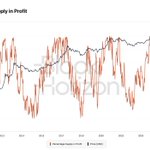
For the first time this cycle, the MAJORITY of coins are underwater. The profit/loss line just flipped to loss-majority.
Historically, when ≤50% of $BTC supply is in profit (n=1,014 days):
Forward 365d median return: +94.2%
We're there now at 47.15%.
Not a confirmed bottom - prior cycle lows went to 36-44.5% - but this is the zone buyers get paid from.🟢
