

Founder and Head of CVC Marathon // Daily Insights on the Markets // Not Investment Advice
United States
Joined September 2023
- Tweets939
- Following114
- Followers8.2K
- Likes353





Pinned Tweet
Powerful combination built on an exceptional investment platform with consistent performance and strong client partnerships
cvc.com/media/news/2026/cvc-…

Follow the Numbers:
● Earnings are booming: Q3 EPS growth is 30.1% year-over-year.
● Broad-based strength: Every sector is delivering revenue and EPS growth.
● Technology continues to dominate: EPS growth of 47.9%, alongside the largest acceleration in revenue. Importantly, excluding the mega-cap tech companies, the rest of the sector is showing even greater breadth, with EPS growth exceeding 100%.
● Energy is the standout: EPS growth of 148.3% year-over-year, led by refiners.
With ~60% of S&P 500 companies reported, Q3 EPS growth is running at 30.1% y-o-y alongside broad top-line gains. Near-term election volatility contrasts with these results and a 3.6% real early Q4 GDP estimate, supporting a strong finish to 2026 regardless of today’s outcomes.

The Intriguing Tale of Two CCCities
Not all CCC-rated credits are created equal as you see in the table below.
The ICE BofA CCC & Lower High Yield Index splits almost evenly: 106 performing issuers (51%, $75.5B face value) versus 101 distressed issuers (49%, $73.2B face value).
Performing CCCs: weighted average price of 93.5, yielding 9.4% with a 465 bps OAS.
Distressed CCCs: priced at 52.4, yielding 43.2% with a 3,912 bps spread.
That is a huge gap inside one rating bucket.
The stronger cohort is growing businesses with real cash flow, access to the capital markets, and a path to deleverage through revenue and EBITDA growth.
The weaker cohort is a cross-section of deteriorating businesses, some facing a maturity wall, some with little or no capital markets access, and all with debt service that has become harder to meet.
All are CCC, but the K-shaped outcome is defined by this dispersion. Owning the index means owning the broken credits alongside the good ones. That is why credit selection is essential. Investors who do the work, separating the borrowers that will repay from those that will not, will capture the premium and avoid the losses. The CCCs that will repay share five traits as shown in the second table below, in contrast credits that are deteriorating.
In my last post, “CCC Cowboys,” I wrote about the harsh outcome when investing in poorly performing businesses, facing difficult liquidity conditions. That was the bear case.
The bull case occurs when a very talented credit manager can perform the intensive credit work, identify the gems. The market is pricing a better than 50% probability of default for CCC-rated debt over the next five years, which means nearly half of CCCs will not default.
Holding the right CCCs can be highly rewarding. These are businesses growing revenue and EBITDA, generating real cash flow, and paying down debt. Over a short 2.8-year duration, that means equity-like returns from a senior position in the capital structure. The best CCCs today are the single B credits of tomorrow, and the market pays a premium to those who own them before the upgrade.
If Charles Dickens were a credit manager, I believe he would have written: "It is the best of credits, it is the worst of credits, and the rating alone will not tell you which is which."


CCC Cowboys
The BB High Yield Index began last week trading at just +227 basis points over Treasuries, suggesting excellent credit conditions, abundant liquidity and strong investor demand.
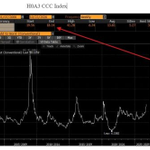
Meanwhile, the CCC High Yield Index began last week yielding 18.14%, signaling considerable financial distress among the weakest borrowers.
At no point in history has the CCC HY Index yielded more than 18% while the BB HY Index traded tighter than +400 basis points (see charts below).
CCC yields are hovering around 18%, while BB spreads tightened further to just +210 basis points.
How can the weakest credits perform so poorly when the economy and corporate earnings are so strong?
GDP expanded 3.4% in Q3, while S&P 500 corporate earnings have delivered exceptional growth, with another gangbuster earnings season underway (25% to 30% EPS growth).
The same divergence is evident in the broadly syndicated loan (BSL) market, where the amount of distressed loans has doubled thus far in 2026.
What explains this extraordinary disconnect?
Weaker borrowers are confronting maturity walls, liability management exercises (LMEs) that merely piled on additional debt without fixing underlying operational problems, over-levered businesses with elevated borrowing costs, changing consumer behavior and technological disruption, particularly across software sector.
This is severely impacting the weakest borrowers.
Consider the historical precedents. CCC yields exceeded 18% during the 2002 recession and telecom bust, the 2008 Global Financial Crisis, the 2016 energy collapse, the 2020 pandemic and the 2022 Fed tightening cycle.
In every instance, BB credits were also under considerable pressure, with spreads ranging from +400 to more than +1,000 basis points.
Not this time.
The credit market is increasingly separating winners from losers. Strong companies enjoy abundant access to capital at attractive rates, while weaker companies face prohibitively expensive financing, shrinking liquidity options, and deteriorating enterprise values.
Hedge funds loaded with CCC credits have become aggressive sellers, particularly those that unwisely employed leverage. The market is pricing over a 50% probabilty of default for CCC rated debt: S&P’s long-run data shows a cumulative default rate for CCC/C of 50% over 10 years.
Despite the YTD value destruction, there is plenty of opportunity in CCC companies that will not default. Significant returns can be earned as I believe that nearly 50% of CCCs will not default, offering the opportunity to purchase low double-digit coupons priced at considerable discounts to par.
The CCC Cowboys that invested in poorly performing businesses are hoping to weather this storm but there may be no way out. Selling your good CCCs does little to protect the capital invested in the remaining positions, but it does help deleverage, which the banks demand.
Storms pass, but deteriorating businesses with structurally unsound capital structures often do not.


Marie Antoinette, Queen of France (1774 to 1792), was said to have declared, “Let them eat cake.”
More than two centuries later, that sentiment has found a new audience in global credit markets. Capital remains plentiful for the strongest borrowers, but increasingly scarce for the weakest. Not everyone will have access to capital, and for those with deteriorating creditworthiness, the cost of borrowing is becoming intolerable.
The credit markets are "A Tale of Two Cities" (also about the French Revolution), the haves and the have-nots, as the bottom half of the K-shaped economy feels the pinch from tighter financial conditions, a rather peculiar development since GDP growth is robust. This tale is being played out across the AI complex, the delta between BBs and CCCs, and even in sovereign credit, as French OATs are feeling the heat.
When the largest borrowers absorb trillions, the marginal borrower pays up or simply fails to raise capital, the lifeblood of existence.
The buildout of data centers in the U.S. is projected to cost nearly $10T over the next 5 years, which is 3.6% of GDP per annum. However, I will take the under, as many projects will not have the capital, power, or regulatory approval to proceed. The four largest hyperscalers are expected to spend over $1T annually (we will get more information this week when they report earnings and discuss their CapEx plans), but with strong profits, multi-trillion-dollar market caps, and AA ratings, these companies can access credit as they build their AI moats. While on-B/S financing may be slightly wide to the IG index, off-B/S debt trades at an extra +100 bps spread.
The neoclouds are relegated to the HY market, where credit availability has become problematic. Today, the largest, most successful neocloud's debt trades at 15%, and its 5-year CDS trades at ~1,100 bps, which is unsustainable. Gartner expects 80% of neoclouds to cease independent operation by 2030, as a shake-up is coming. The hyperscalers with strong balance sheets are in a position to pick up the pieces.
France's 5.4% fiscal deficit, debt-to-GDP ratio of 120%, and 10-year OAT yield above 5% saw its spread to Bunds reach 178 bps last week. France pays more than Italy, putting its credit rating at risk. In the U.S., 6% deficits are not favorable either. However, access to capital is the key, and despite a $2 trillion funding gap for the current fiscal year, the market is open and willing. This crowds out other borrowers by raising the "risk-free" rate. When sovereigns pay more, everyone pays more.
IG spreads and BBs are below long-run averages, while CCC spreads have blown out to ~1,300 bps, the widest on record during a time of prosperity (i.e., "let them eat cake").
Takeaway 1: It's a lender’s market.
Takeaway 2: 2027 should be great for Direct Lending and Opportunistic Credit; the best vintages occur when capital is scarce, spreads are wide, and lenders are selective.
Risk Assets & Pain Points:
1. French OATs: localized stress point or systemic? Liquidity for sovereign debt is thin. When sovereign spreads widen, credit tightens for everyone else too: corporates, consumers and assets. Watch France, Italy and Spain, this will tell us a lot about Europe.
2. CoreWeave at 1,000+ bps: value or value trap? Crashing token prices change ROI, many in the industry are concerned with how open v closed source dynamics and rising rate structure will affect neoclouds. Yet, spot pricing for GPUs are consistently trending higher given difficulties bringing compute online relative to demand for compute.
3. AI and datacenter CapEx drove GDP in 2026. In 2027 it may slow or it may keep growing, and those two paths lead to very different outcomes for growth, earnings, and credit spreads. This is now the most important swing factor in the macro outlook.
4. The lack of regulatory support at state and local levels across much of the U.S. coupled with the shortage of power puts significant strain on building AI capacity to the planned extent at the current juncture. As Elon stated this week, "Getting the money to build complex systems (data centers) with massive power, cooling, and networking is not the same as doing it."
5. Liability management exercises were meant to buy time. Too many have only pushed the default further out and left lenders with lower recoveries. Expect more repeat restructurings, and more fights between creditors. CCC’s may see its highest default rates in many years.
6. Software was the favorite sector in direct lending, priced on ARR. Now AI is threatening seat-based pricing models, as the maturity wall approaches when companies are carrying too much high leverage against weaker valuations.
7. PIK for profitable, growth companies chosen at the start of a deal is an important capital structure tool while PIK turned on later to avoid a payment default is is simply bad. Bad PIK is ticking up, and a sign of current times in DL land.
8. Datacenters that can’t secure power or water is the new case study, or basic test that every credit, infra and CRE investment analyst should take when sitting for an interview.
9. Long-duration UST are down 50 points from their issue price. The “risk-free” 1.25% bonds due 2025 are trading at price of 42 cents on the dollar. While Duration has been a source of pain, term premium is back, which is the most favorable in years. Higher for longer.
10. Zombie PE, CRE, and Credit funds are on the rise. Investors across the wealth spectrum must remain vigilant, investing only with time tested proven winners, as dispersion will be extreme now that the tide has moved out.
With all these worries, it will create a ripe environment for Oppotunistic Credit. I cannot think of a more interesting time, experience and expertise is the delta.
The Software Hangover Is Not Going Away
Software is a major component of the approaching maturity wall that I discussed yesterday in my daily post.
On one end of the extreme, large publicly listed software companies with little net debt (average is ~0.5x), those with strong moats and substantial cash generation are well positioned as the Rule of 40 defines success for this sector. These businesses with proprietary data, cybersecurity franchises, or software embedded in mission-critical hardware systems and high switching costs have actively invested through the AI transition to become AI-first software enterprises, positioned well for the future.
There is a big difference between a public software company that has an infra or cyber moat vs. SAAS as you see below in this table. Private companies, smaller enterprises are obviously much less valuable.
At the other end of the spectrum there are the 1,000+ smaller, sponsor-backed SaaS companies, levered 6x, 8x or 10x debt-to-EBITDA, that are far more susceptible. Their products are often vertical, with a customer base that is more concentrated while their technology is significantly easier to replicate as the cost of software development falls.
As token prices fall, the cost of building, maintaining and replicating software declines sharply. A small team of developers using Cursor, Claude Code or Codex, may be able to recreate comparable enterprise functionality in days rather than years.
Consider a borrower at 10x debt-to-EBITDA. The sponsor may claim 6.5x after add-backs for “one-time” costs that recur annually. A recurring expense is not one-time.
Important questions to consider are:
Will strong historical retention translate into durable ARR over the next five years?
Can margins be defended as enterprise code can increasingly be produced at token prices legacy vendors cannot match?
Will agentic AI reduce seat counts, compress ARR and weaken revenue durability?
If coding costs approach zero, what happens to competitive moats and terminal value?
BDCs and Direct Lending funds hold several hundred billion dollars of software exposure. The risk is now much better understood.
With eyes wide open, few lenders are currently willing to extend new credit on prior terms.
Where new loans are available, they often provide only two to three years of runway, priced at +100 to +200 basis points of additional spread, cash-flow and leverage covenants required, and 5% to 10% annual amortization. New software credit likely support only around 4x leverage, if financing can be obtained.
Existing lenders are willing to waive covenants, permit PIK, or extend maturities in an effort to avoid default, requested a cash sweep if the sponsor is negotiable in an effort to avoid a technical default.
Amend and pretend delays loss recognition. Kick the can down the road has become too familiar a strategy in private credit.
And yes, I am sticking with my call, this maturity wall will lead to a default wall.

The Maturity Wall Is Approaching, Eyes Wide Open
In public credit, the par balance of distressed high-yield bonds and broadly syndicated loans has risen to roughly $220 billion. CCC-rated high-yield spreads now exceed 1,000 basis points, firmly in distressed territory, and have widened by more than 300 basis points year to date.
Meanwhile, overall high-yield spreads remain contained at around +310 basis points versus U.S. Treasuries. The divergence is telling: CCCs are underperforming materially despite resilient growth and still-strong corporate earnings. That is not the pattern one would expect in a healthy late-cycle credit environment.
The same cracks are emerging in private credit.
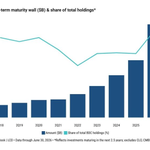
According to PitchBook, 22% of BDC loans or $117 billion now mature within 2.5 years. At the same time, deeply discounted loan marks, adverse document amendments, PIK interest, covenant waivers and non-accruals are rising, notwithstanding the economy’s underlying resilience. The maturity wall for DL funds is just as big and is also approaching fast.
Problems are brewing in both public and private markets. 2027 is likely to be a year of dispersion: between single names, between sectors, and critically, between fund managers. It should be a necessary correction, one that restores discipline to underwriting, capital structures and valuation marks.
When conditions are benign, most managers can perform well. But when the tide goes out, it reveals who has been taking undue risk, and who has maintained genuine credit discipline.
The 2027 opportunistic credit vintage should therefore be among the best in years

Rising AUM Does Not Equal Inflation
Management fees are included in the PCE inflation calculation, the Federal Reserve’s preferred inflation measure. In the most recent PCE report, a methodological revision to the way portfolio-management and investment-advice services are measured was responsible for much of the downward revision in core inflation.
That adjustment makes perfect sense, as this input to inflation was mis-characterized; and has now been corrected.
Asset management is not like buying eggs. Managers charge a percentage of AUM. If markets rise, AUM rises, and the aggregate fees increase, even when the stated management fee has not moved at all, or may have declined.
If a client pays 1% on NAV to manage a portfolio worth $100 million, the annual fee is $1M. If the portfolio rises to $150 million and the manager is still paid 1%, revenue increases to $1.5M. The service was not repriced. The portfolio became more valuable.
This distinction matters as a methodology that interprets growth in fee revenue resulting from higher asset values as an increase in the price of financial services overstates inflation.
The reality across much of asset management has been the opposite: there is a long-running deflationary trend. Mutual funds continue to lose assets to lower-cost ETFs. Large institutions with scale negotiating lower fees, co-invest rights, with a basis point cap on fund expenses.
The revised approach offers a more accurate distinction between market-driven AUM growth and actual service-price inflation.
Thank you to the Commerce Department for identifying this issue and revising the methodology to more accurately reflect inflation; or the deflationary pressures in the asset-management industry.
Too Big to Fail or Too Large to Finance Without Higher Yields? It is the latter.
The next systemic risk may not be a large bank, a single sovereign, or a industry sector, it may be the collision of multiple, economically indispensable demands for capital at a time when government deficits are already enormous and the marginal buyer of duration is demanding more compensation.
The US needs to fund fiscal deficits and a historic volume of Treasury issuance. The AI race is driving an extraordinary capital-spending cycle across hyperscalers, datacenters, semiconductors, networks and power, collectively requiring several trillions in financing annually.
When Treasury issuance, investment-grade corporate issuance, AI infrastructure debt compete for the same pool of capital, markets clear through price. That price can be a higher term premium, higher real yields, wider credit spreads, with all three now converging.
Investors view UST as risk-free, while IG hyperscalers as among the safest corporate credits. But “safe” does not mean immune to a higher cost of capital. A highly profitable company with huge CapEx needs will pay a wider spread v. UST ay the same time the risk-free yield curve has shifted upward. Hyperscalers CapEx exceeds $1T at current run-rate, while UST runs a $2T annual deficit.
This week’s UST quarterly auctions will be a good test.
Europe presents a related but different risk. The issue is not simply debt supply; it is sovereign differentiation. France, Italy, Spain and Greece may share a currency, but they do not share identical fiscal positions, or market perceptions of risk.
We saw this during the euro crisis a dozen years ago, when Greece, Ireland, Portugal and Cyprus required support by the Troika as this sovereign crisis led a “whatever it takes” approach to stem the loss of confidence. Europe is stronger w/more tools, but widening OAT-Bund spreads to 152bp is alarming as the leveraged basis/carry trades are unwound with thin liquidity. France is central to all of EU - Persistent pressure would pose a more fundamental question about fiscal credibility, political cohesion.
The greatest opportunities in credit rarely emerge when confidence is high and capital is abundant, rather they emerge when fear rises, liquidity retreats. That is when disciplined capital, those with deep underwriting skills and a willingness to separate temporary dislocation from permanent impairment earn its highest returns.
While US Treasury market, Europe, and IG AI infrastructure are too big to fail, the question is whether markets will finance all of them at yesterday’s yields.
The emerging risk is not an absence of capital, it’s the higher price for it and for credit investors, earning higher yields create a windfall profit. Capital allocators should chose a higher R*, differentiated credit selection, experienced risk managers, and unique deal flow as collectively it provides a compelling time to deploy.
Payback Lower for Many Pay-Later Loans
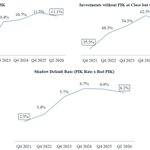
Direct Lending bad-PIK has become a problem; borrowers falling behind plan, debt service <1x. Solution: defer the interest payments, just add it to principal owed. BUT, leverage climbs exactly when the business is weakest. PIK currently runs >11% of BDC portfolios with 55.4% classified as Bad-PIK (i.e. PIK not part of the original terms).
Consumer credit BNPL to subprime borrowers is the consumer version of bad-PIK although technically the BNPLs are originated at discounts to par to support the economics as they are originally as the high implied interest charged is built into the discount. BNPL receivables self-liquidate in six weeks, as the exposure ultimately consolidates at the household level: a subprime borrower borrowing across multiple lenders that don't see each other.
The aggregate position is too highly leveraged, with debt adding up as time rolls along. A FICO score below 620 is the consumer equivalent of a CCC corporate credit, and roughly 60% of U.S. BNPL borrowers sit in subprime or near subprime.
About 41% report paying late. The consumer is spending beyond current income, late fees and rollovers push the implied rate well into distressed levels, and repayment is deferred to a future. While the reported 'defualt rate' is low for BNPL, a rising percentage of BNPL are falling further behind on their payments. While the mechanics for BNPL are not similar to bad-PIK toggle, both relate to weaker credits made outside of the banking system by the private sector.
Allowing lower-rated companies that do not have cash flow to service its debt or, alternatively, lending to stretched subprime consumers whom have taken on too much additional debt usually result in higher default rates any way you stack it.
PLPL (pay-late, payback-lower).
Takeaway #1: Lend to companies and consumers whose cash flow can comfortably service the debt and ultimately repay principal or lend against hard collateral where you hold a perfected security interest and a real margin of safety (LTV).
Takeaway #2: PIK at close, structured for growth companies have a completely different IRR/MOIC profile vs. Bad-PIK.
Takeaway #3: Rates will be higher for longer as the Fed has begun to tighten, allowing lenders to be paid handsomely. It continues to be a great time to invest to be a private and public credit investor.
Takeaway #4: With interest rates higher, interest expense/debt service will be impactful for a greater percentage of private credit issuers who may fall below the critical 1x debt service coverage ratio; thus bad-PIK ratio may increase in the coming months.
Takeaway #5: The K-shaped economy is alive and well; while corporate earnings grow, the economy thrives, over-levered/weaker companies struggle as rates rise.

The Fiscal Problem Is Not Going Away.
The U.S. fiscal deficit is now running at more than 6% of GDP, and we are approaching a new fiscal year with a massive financing requirement.
Washington is running a deficit of $2T, and the Treasury will continue issuing enormous amounts of new debt to finance that spending and refinance existing obligations.
This matters because deficits are not just a Washington problem. They are increasingly becoming a bond-market problem.
Massive government spending supports demand at a time when inflation remains above the Fed's 2% target. That can make the Fed's job more difficult: fiscal policy is pushing demand higher while monetary policy is trying to restrain it.
And there is another consequence too: Supply, a deluge of debt.
Investors will demand compensation for absorbing that supply, particularly when inflation remains elevated and the Fed is no longer providing the same support to the long end of the curve via QE.
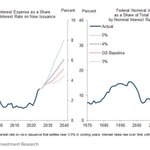
The 10-yr UST move above 5%, levels not seen since 2007 is costly as you see in the chart below.
Higher Treasury yields mean higher borrowing costs for the government, corporations and consumers.
They also raise the discount rate applied to equities, reducing the present value of future cash flows.
This creates a difficult feedback loop: more spending requires more borrowing, more borrowing requires more Treasury issuance, and more supply can require higher yields.
Higher yields then increase the government's interest expense, creating even more pressure on the deficit.
Where has fiscal discipline gone?
For credit investors, there is a silver lining: higher base rates mean higher income for lenders and savers.
In a higher-for-longer world, the winners will be lenders who focus on companies with strong cash flow, conservative leverage, solid covenants and the ability to grow through the cycle.

Strong Economy, Record Earnings, Yet Credit Stress is Growing at Leading BDCs as Non-Accruals Surge
The economy remains strong, with continued tailwinds: corporate earnings are on their strongest growth trajectory in years, equity markets are at all-time highs, and the Fed is holding rates steady.
That is an attractive backdrop for credit. As companies grow earnings relative to their outstanding debt, credit fundamentals can improve meaningfully.
Yet stress is building as the Top-10 BDCs have seen non-accrual debt climb to an alarming 5.95%, according to PitchBook and LCD data.
The rise in PIK and non-accruals does not yet fully capture the problem brewing in software as BDCs have high exposure to this sector. The bigger issue for software is valuation: leverage levels are increasingly out of proportion to current enterprise values. That disconnect will ultimately need to be resolved, particularly as the maturity wall comes into focus over the next three years.
For capital allocators, now is the time to ask the hard questions to understand how clean the portfolio is.
Questions to ask:
How many companies have no covenants?
What percentage and which specific issuers have/will require extensions or amendments to avoid default?
What percentage are now PIK? What percentage are non-accruals?
The current vintage should generate strong returns, in my view. However, legacy issues from the prior vintage will take time to work through. Buying into a fully seasoned portfolio can often be an attractive way to invest, but my strong preference is for a pristine portfolio - one where all loans are performing on plan or ahead of plan, with no underlying issues that need to be worked out.

Bruce Richards retweeted

"It's the most important capex buildout that we've ever seen in this country in terms of actual size and what it means."
@Bruce_Markets, head and managing partner of CVC Marathon, explains how private credit is stepping up to finance data centers and AI:
cnbc.com/video/2026/08/18/gl…

Capital as a Moat: Compute
The AI buildout is the largest infrastructure investment cycle of our lifetimes, and it is just getting started. For years the debate centered on talent, data, and compute. A fourth input now belongs on the list: capital. Goldman believes the Digital Infrastructure build-out will be ~$7.5 Trillion through 2031. Public and Private Credit, both Corporate and Asset-Based are central components to the AI build-out. This is one of the great capital formation stories in market history, and credit sits at the center of it.
The strongest builders understand this. An A or AA credit profile with deep operating cash flow can finance capacity before demand is fully proven. Capital is abundant, but it will not be priced equally, and an edge in borrowing cost, structure, and speed compounds into strategic advantage. Financing intelligence and scaled capital is invaluable in executing.
We underwrite these financings every day, and here are a few of the many key questions:
1. Who stands behind the revenue, and are we paid for it? Investment-grade counterparties anchor the tightest structures, while non-IG contracts can offer the best risk-adjusted returns when the spread, collateral, and covenants reflect the credit.
2. Does the debt amortize inside the contract? Loan maturity should never outlive the revenue that services it.
3. What is the collateral worth in year five? NVIDIA stands apart: best-in-class GPU hardware, and in CUDA the ultimate moat, an ecosystem that keeps chips productive for years and underpins meaningful residual value.
4. Is the power secured? Power, land, and interconnection are the scarce assets. GPUs can be bought; megawatts must be won.
5. Are the structural protections real? A perfected interest in the collateral, DSCR covenants, and cure rights separate true asset-based lending from lending on hope.
Hard assets, low obsolescence, contracted cash flow, strategic scarcity. Expect the best-capitalized compute platforms, neoclouds, and AI companies, along with their lending partners, to compound advantages in the years to come.
CPI is at the lowest level since COVID (March ‘21).
I expect no Fed hikes in 2026 (next move is lower, not higher); markets are pricing futures incorrectly.
No Rate Change, Yet Big Changes Ahead:
The Fed meeting that begins today will likely result in no policy rate change announced tomorrow; however, significant changes are coming to the Federal Reserve.
Fed Chairman Kevin Warsh has assembled five task forces of high-powered thought leaders from former central bankers, top academics, business executives, and investors to examine some of the most important aspects of how the Fed operates:
Communications, Balance Sheet Policy, Data, Productivity and Jobs, and Inflation Framework.
Warsh is not looking to make incremental changes; he is challenging some of the fundamental assumptions that have shaped monetary policy since the GFC, and generations prior.
Communications: Warsh has argued that the Fed should provide less forward guidance, which allows maximum flexibility. With fewer words, the dot plot will come to an abrupt end, as this is an experiment that proved to be highly ineffective. The dot plot is the antithesis of what Warsh plans to communicate to markets.
Balance Sheet: Warsh has been a longstanding critic of QE and the Fed's enormous balance sheet. While the task force will likely determine that wholesale reversal will be difficult, we should expect this re-examination to limit its use going forward printing money is inflationary and poor policy, other than the most extreme case.
Productivity and Jobs: Warsh has described AI as "structurally disinflationary," and I agree with the long-term thesis. AI should drive enormous productivity gains and lower the cost of producing goods and services. This task force will prove consequential as it evaluates structural change of employment and inflation. I agree with Chair Walsh's assessment, however in the short-term the AI buildout is inflationary for segments of the economy such as the cost of data centers, electricity generation, gas turbines, transformers, chips, memory and networking equipment; while the long-term impact should be deflationary as productivity accelerates and technology reduces costs. The challenge is that monetary policy operates in the present, while the productivity benefits of AI may take years to fully materialize.
History does not repeat itself, but it may rhyme.
It's the Roaring 20's, and the massive market move has created enormous wealth creation during this decade. While history does not repeat itself, it can rhyme, and this parallel makes for a worthwhile conversation.
From August 1921 to September 1929, the Dow rose six-fold, from 63 to 381, powered by the transformational technologies of the age: electrification, the industrial revolution, and mass production on the assembly line.
During the decade 100 years ago, real GDP compounded at 4% per annum as productivity surged. While innovation was real, the 1929 stock market crash led to a run on the banking system, and given the 89% peak-to-trough decline in equities 25 years to fully recover (chart below).
Unlike the 1920's, our banking system is incredibly healthy today, and while the equity market is up 132% this decade, P/E multiples reasonable (19x forward earnings) as earnings growth are strong and the economy is growing in the 2% to 3% range.
Leading up to 1929, investors bought stock with just 10% down, financing the rest with broker/bank call loans that led to margin calls, forced selling and the market collapse. The economic development was real, while excess speculation and a fragile financing market turned a boom in the financial markets to a bust as the perils of Wall Street spread to Main Street.
I am not calling for a crash; today's equity valuations are reasonable with earnings that are only modestly above its 10-year average, and earnings growth in 2026 exceeds 20% y-o-y, its strongest stretch in years. It is not 1929, and it is not the dawn of dot-com burst when price detached from earnings.
We should all keep a close eye on leverage. FINRA margin debt is ~$1.5 trillion, up 50% over the past year, or 4% of GDP vs. a median of 1.5% historically. Andrew Ross Sorkin's brilliantly written book "1929" is a history lesson that excessive leverage driven by greed and speculation is dangerous.
Morgan Stanley and Goldman Sachs estimate the AI buildout will be >$1.1 trillion in 2027 and 2028, respectively. While the large hyperscalers lead the way, and AI transforms industry leading to massive productivity gains, the biggest strain is on capital as governments compete with private sector to attract capital. The stress today, is not leverage or valuations, it is the need for capital, providing capital allocators with unique and important choices.
The lesson of the first Roaring 20's that is most relevant to today is determine if there is a widespread mis-allocation of capital (e.g. speculative leverage, bad loans, bubbles) that can have a material knock-on affect(s). With more than 60% of households now owning equities, versus only 10% in 1929, the real economy is far more wired to the market than it was then, but at the same time, this development has led to massive wealth creation, which is certainly net-positive.

Equity Performance and its Impact on the Economy
Over the past 15 years, consumer household net worth in the U.S. has grown from $63 trillion in 2011 to $174 trillion as of June 18, 2026, per the Federal Reserve (shown below). The American household balance sheet has nearly tripled in fifteen years, with the equity markets contributing more to wealth accumulation than home price appreciation.
The gains are concentrated by education, age, and asset class:
- 90% of the wealth is held by those who attended college.
- 94% is held by those 40 years of age or older, as wealth accumulates over a longer working career.
- Equities are held by a far wider share of the population compared to any prior generation, with more than 60% of U.S. households holding equities, that is equiveleant to more than 60% of the market value of all U.S. equities. In 1990, fewer than one third of households owned equities, and 100 years ago the number was 10%.
- In comparison, home ownership has plateaued as affordability has plateaued, yet home price appreciation has continued to trend higher.
The average U.S. household has ~$700,000 in wealth, while the median sits at $69,000, a differntial that is driven by the concentration of wealth at the very top; at the very top of the wealth chain Elon Musk is #1, the world's first trillionaire. Switzerland leads the global country leaderboard with the average household of ~$900,000. The U.S. is home to 36% of all global household wealth, ranking #1.
Far more wealth creation has come from equity price appreciation vs. HPA: the risk profile of consumers has changed. When wealth was anchored to home equity, sentiment to equity markets behavior was less pronounced, however, wealth and equities reprice real time, and it transmits to confidence, spending, and consumer credit far faster.
It will be very interesting to observe how consumers respond during the next equity bear market as ths consumer reaction function will impact sentiment for debt and equity investors, alike.
While history is not likely to repeat, sometimes it is remarkable how well is rhymes. The 'Roaring 20's' was exactly 100 years ago, and today's 20's has some similarities that are worth noting, which is the topic my post tomorrow.
Stay tuned.
Activate to view larger image,

The 1-in-5-Quadrillion Photo
December 2007. A UNICEF charity calendar shoot in Barcelona. A 20-year-old Messi bathes a five-month-old baby from Mataró.
This Sunday, that baby faces him in the World Cup final.
The chain of events required:
1.That specific baby gets picked for the shoot = 1 in 5,000
2.Messi is the player he’s paired with = 1 in 20
3.The baby grows up to become a professional footballer = 1 in 10,000
4.Messi is still playing 19 years later, at age 39 = 1 in 50
5.Argentina and Spain both survive a 48-team bracket and meet in the final = 1 in 20
6.Messi becomes the greatest Argentine player ever = 1 in 10
7.Yamal becomes the best player in Spain = 1 in 500
Multiply it through:
5,000 × 20 × 10,000 × 50 × 20 × 10 × 500 = 1 in 5 quadrillion (5 × 10¹⁵)
For scale: that’s the same as picking one predetermined second at random from the last 160 million years, every second since the Jurassic, and landing on the exact moment Messi is holding the baby.
Sunday at MetLife, both ends of the chain walk out of the same tunnel.
One of them leaves with the trophy.
