

Cyclical Analysis & Fundamental Fair Value Exhaustion Signal Scanner: https://nitter.gq/t.co/qRl0z7Ju4X Indicators: https://nitter.gq/t.co/9BlM3ePXDV
Joined May 2021
- Tweets12.6K
- Following377
- Followers11.2K
- Likes31.3K
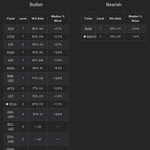
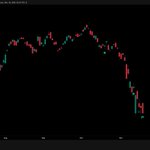





$NVDA - Bullish level 3 exhaustion signal on the daily. Potential double-bottom, market dependent.


ChartingCycles retweeted
Golden Cross Cycles indicator now available on @tradingview: tradingview.com/script/kVJmv…


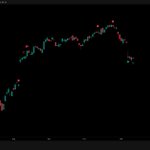
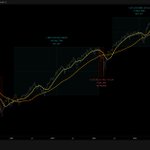
$SPX - Has had 3 golden cross bull runs since the pandemic... will this one end here, or continue on?

ChartingCycles retweeted

$INTU bullish case:
Fundamentals:
- Bookkeeping & Payroll is monthly expense that has to be paid by small businesses regardless of how profitable they are. (my monthly with them is $200/month whether I make any money or not).
- business owners, like me, want to know that their most sensitive data is protected and managed by a large institution that has years of history. Intuit has been in business for 43 years and has weathered all previous tech cycles.
- the "AI will replace all software" narrative seems to be eroding. Intuit has the resources to be one of the forefront innovators in integrating AI into their applications. If they don't make it themselves, they can buy it out and integrate it, which is one of their key successes.
- pays a 1.71% dividend yield while you wait.
Technicals:
- double bottom appearance vs. the '22-23 timeframe
- weekly divergence on RSI
- Monthly & Weekly bullish exhaustion signals from @ChartingCycles
- Fundamental Fair Value indicator (Beta version by @ChartingCycles ) is saying very undervalued with 137.6% upside to reach fair value of $797/share. Forward fair value is $1,033/share.
- Reclaimed the bull market support band
- Reclaimed the 50 and 100 SMAs (retesting them currently)
Buy zone: $265-330 for long-term hold.
@CerlogicFounder would love your thoughts on this one.

$QQQ hanging on at the 50w MA, which it has been above for 79 weeks.
Just posted an update to my Moving Average Cycles indicator: tradingview.com/script/R8bMY…

Golden Cross Cycles indicator now available on @tradingview: tradingview.com/script/kVJmv…
$SPX - Has had 3 golden cross bull runs since the pandemic... will this one end here, or continue on?
$SPX - Has had 3 golden cross bull runs since the pandemic... will this one end here, or continue on?


$SPX - 50d MA starting to curve downwards, but still plenty of room between it and the 200d. #GoldenCross

9
1,581
$SCHW - Bullish exhaustion signal on the weekly. 90% win rate over 20 signals, median move of +8.8%.


ChartingCycles retweeted
Updated Seasonality indicator has been released!
tradingview.com/script/i1TZi…

$BTC - Near-term trough should be setting soon if it is to continue the cycle pattern.


Daily Exhaustion Signals – 11/6/26
↓ $FSLR Bearish L1
↑ $CRM Bullish L1
↑ $KMI Bullish L1
chartingcycles.com/2026/11/0…
