

Helping employees maximize income | Founder of CheatCode Wealth | Paycheck》Assets》Passive Income》Life | Join the newsletter | Not financial advice
Oregon, USA
Joined March 2023
- Tweets11.4K
- Following982
- Followers1.3K
- Likes5.4K




Pinned Tweet
You spend 40 hours per week earning a paycheck.
Invest 10 minutes per week learning how to make it grow.
Join the newsletter
portfoliosbedtimestories.kit…

77
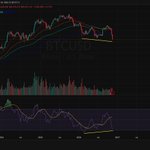
4 Charts that matter for $BTC:
Today, bitcoin is making a new low during this 4-year cycle. The weekly RSI has potential to print a divergence. This is important as we look back to previous cycle lows...

1
1
109
And the cycle before that bottomed in August 2015 with a lower low with divergence on the weekly RSI.

1
11
Garrett🔸️CheatCode Wealth retweeted

S&P 500 $SPY just flashed capitulation for the 2nd time all year 👀

Is the semiconductor boom over?
Reliable signs the semiconductor business cycle is turning down (Nov 2026 check):
1. Rising inventory / higher days of inventory
Micron DIO ~141–147 days (elevated vs past peaks). Nvidia DIO up modestly to ~124. Korean memory makers show higher total inventory, mostly WIP for HBM/server demand, with utilization at 100% and finished goods not piled up.
Classic glut signal: Absent
2. Book-to-bill below 1
PCB book-to-bill still ~1.12. Equipment orders generally supportive of expansion. No broad sub-1 reading indicating order weakness.
Absent
3. Margin compression or ASP declines
Memory operating margins ~70–80%. TSMC gross margin ~66%. Pricing power intact and ASPs firm/rising on tight HBM and advanced logic.
Absent
4. Hyperscaler / major customer capex cuts
Big-4 2026 guidance still ~$700B+. 2027 estimates continue to rise (consensus $900B–$1.2T range). No broad downward revisions.
Absent
5. Sequential revenue declines (beyond normal seasonality)
Q3 2026 industry sales up sharply sequential and YoY. Most major players (TSMC, Nvidia, memory, equipment) still guiding growth or stable. Isolated soft spots exist but not sector-wide.
Absent
6. Falling capacity utilization
Foundry utilization ~90%+ (some mature nodes tight). Memory lines at or near 100%. Lead times extended, not idle tools.
Absent
7. Widespread order cancellations or pushouts
Long-term agreements in place. Supply remains constrained (HBM, CoWoS, leading-edge). Sold-out commentary persists into 2027.
Absent
Bottom line: Equity prices have corrected sharply ($SOXX ~35%+ off highs), but the fundamental cycle indicators above have not yet confirmed a downturn. Assuming that price action alone signals the end of the cycle is a gamble, and a poor one.
$NVDA $AMD $TSM $MU
1
73
Garrett🔸️CheatCode Wealth retweeted

The $VIX increased 86% this week, its 4th biggest weekly spike ever.
What has happened in the past following the biggest $VIX spikes?
Stocks have tended to bounce back with above-average forward returns.
Does this always happen? No. There are no certainties in markets, only probabilities.


Garrett🔸️CheatCode Wealth retweeted

I’m seeing a lot of investors defending tech stocks by pointing to their forward P/E ratios. It’s a dangerous way to think about valuation, particularly in semiconductors.
At the top of a cycle, earnings often look their strongest, margins are unusually high and analysts assume the good times will continue. Ironically, that’s when a stock can look its cheapest.
A stock trading at 20 times earnings isn’t cheap if those earnings are about to halve. Suddenly you’re paying 40 times, and that’s before the market starts cutting the multiple too.
I’ve seen this mistake repeated over decades. The real question isn’t what multiple you’re paying today. It’s how much of today’s earnings are actually sustainable.
That’s the difference between looking at a valuation and understanding one.
The $QQQ closed at $609.88
At $601.71 its cheaper than the COVID bottom in March 2020 on a diluted earnings basis.
At $471.00 its cheaper than the COVID bottom in March 2020 on a cash flow basis.
2
79
Two refunds that people leave on the table: one is sitting in the extended warranty you bought with your car. The other is in your property tax bill.
Ask for the cancellation form in writing and track it.
portfoliosbedtimestories.kit…

29
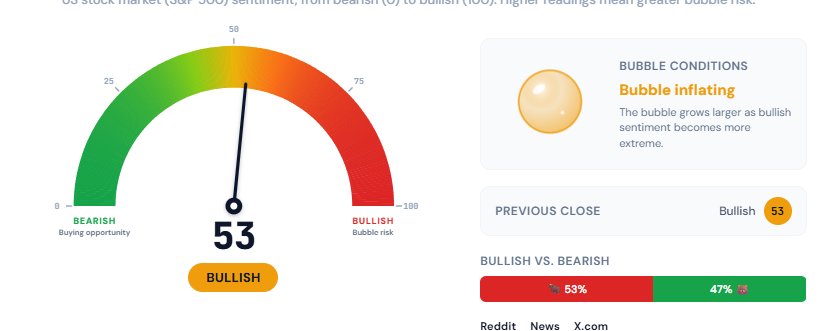
CNN Fear & Greed vs. Bubble Sentiment Gauge: different tools, both useful at the extremes.
The CNN’s Fear & Greed Index averages seven market indicators equally: S&P 500 vs. its 125-day average, NYSE 52-week highs vs. lows, McClellan volume breadth, 5-day put/call ratio, VIX vs. its 50-day average, 20-day stock vs. bond returns, and junk vs. investment-grade yield spread. The index provides readings from "Extreme Fear" to "Extreme Greed."(cnn.com/markets/fear-and-gre…)
The Bubble Sentiment Gauge aggregates real-time sentiment scores from X, Reddit, and financial news focused on the S&P 500 (data via Adanos). It looks at the bullish/bearish tone of what people are actually saying and writing online, then inverts the crowd’s consensus into a 0–100 Bubble Score ranging from "Very Bearish" to "Very Bullish." (cheatcodewealth.com/market-b…)
Both are contrarian tools. Fear & Greed is tighter on current market behavior and shorter cycles. The Bubble Sentiment Gauge is wider on the sentiment narrative over longer periods.


55


There is only one fair way to slate the College Football Playoff teams:
EVERY CONFERENCE CHAMPION
10 Conferences
10 Champions
10 Bracket positions
"That cant work, some conferences are terrible!"
They wont be terrible when teams redistribute to other conferences for a better chance to be the champion.
Whats this really about?
Money
Or winning
Every. Conference. Gets. In.
59

