

Bitcoin and Ether 15-minute moves after US releases (CPI, payrolls, Fed, PCE, PPI), measured since 2021. We neither sell nor endorse tokens/coins.
Mare Tranquillitatis
Joined May 2023
- Tweets546
- Following1.1K
- Followers738
- Likes318






Stocks, oil, gold, silver, crypto. All down.
Day 5 of this multi-market selloff: $BTC −8.44% at its lowest so far.
If it plays out like March 2020, the worst came on day 1 (−37.26%) and it was back on day 8. Like August 2024: low −15.75% on day 1, back on day 4. Like January 2026: low −27.48% on day 7.
Which one do you think is this?

1
13
Bitcoin around this selloff, beside March 2020, August 2024 and January 2026: clometrix.com/macro/selloff-…

7

All 12 Bitcoin death crosses since 2014, each day by day for 120 days, with Ether beside it: clometrix.com/macro/bitcoin-…

11
Released: Michigan Sentiment (Final).
Bitcoin in the first 15 minutes: −1.37%, within a range of 1.69%.

15
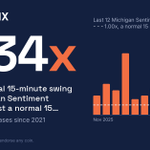
7 of the last 10 Michigan Sentiment (Final) releases moved Bitcoin more than its usual 2.34 times.
Michigan Sentiment (Final) at 10:00 a.m. ET today.
Bitcoin's price usually swings 2.34 times as much as normal in the 15 minutes after this report, the median of 70 releases since 2021.

1
28
−20.95%: Bitcoin's lowest point since the US midterm polls closed on 3 November, reached on day 17. $BTC
The last three midterms, its lowest point and where it stood 120 days later:
2022: −16.55% on day 13, then +17.04%
2018: −51.61% on day 39, then −40.79%
2014: −53.81% on day 71, then −17.94%
This one is already deeper than 2022. Which past midterm does it look most like to you?

1
11
Every midterm since 2014, day by day, with Ether beside it. The 2026 page updates hourly: clometrix.com/macro/us-midte…

7
21.19%: how far Bitcoin is below its price on 8 September, the day of its last golden cross, 73 days later. Of the 11 golden crosses before it since 2014, only 3 had a deeper low inside 120 days: July 2014, July 2015 and February 2020. Day by day: clometrix.com/macro/bitcoin-…

10
Bitcoin is down as much as 4.51% so far in this week's global selloff.
In March 2020, it lost more than a third of its price in a single day.
We measured Bitcoin through every cross-market selloff since 2020, the times when stocks, gold and crypto all fell together. Here is what the numbers show.
March 2020
Bitcoin fell 37.26% at its lowest point, on day 1. More than a third of its price, gone in 24 hours. It was back to its starting price by day 8. After 120 days it was up 52.39%. Ether fell 37.17% the same day and was up 74.72% after 120 days. The Dow closed 2,352 points lower that first day, its worst day since 1987.
August 2024
Bitcoin fell 15.75% at its lowest, again on day 1. It took just 4 days to get back to where it started. After 120 days it was up 64.79%. Ether fell harder, 21.49%, and was up 35.50% after 120 days. Japan's Nikkei 225 fell more than 12% that day.
January 2026
This one was slower and deeper. Bitcoin fell 27.48%, and the low came on day 7, not day 1. It was still below its starting price after 120 days, down 10.77%. Ether fell 35.98%, more than a third. Gold futures fell 9% and silver 27% in a single day.
November 2026, so far
We are on day 4 of 120. Bitcoin's lowest point so far is 4.51% below where it stood at the US open on Monday 16 November. It has not yet climbed back to that price. Ether's low so far is 4.77%. Bitcoin had already fallen 14.10% in the week before. The S&P 500 fell 1.88% on the first day, and on 18 November gold futures fell 2.74% and silver 4.86%.
Crypto's own collapses lasted longer
After Terra collapsed in May 2022, Bitcoin fell 51.00%, about half its price, with the low on day 43. It was still down 45.09% after 120 days. After the Celsius freeze in June 2022 it fell 31.62% and was not back after 120 days. After FTX filed for bankruptcy that November, it fell 10.56% and was back on day 24.
The short version:
In two of the three past cross-market selloffs, Bitcoin's worst moment came on day 1 and it was back within 8 days. In the third, it was not back after 120 days. Three cases are too few to make a rule.
Our live page updates every hour, with Bitcoin and Ether day by day and side by side with each past selloff:
clometrix.com/macro/selloff-…
Figures as of 7:35 PM SGT, 20 Nov 2026. Data only, not advice.

17,015
6 of 25: how often Bitcoin rose in the 15 minutes after payrolls beat consensus by more than 70K. When it missed by that much, 9 of 10. Payrolls on 4 December is open in the calls game: call the figure and Bitcoin's move. Free account, nothing staked. clometrix.com/calls?utm_sour…

22
Initial Claims beat at 203k, Bitcoin volatility 0.51x, lowest in 12 releases. Next catalyst: Michigan Sentiment at 10 AM ET Friday. clometrix.com/news/macroecon…

39
Michigan Sentiment Final due Friday at 10:00 AM ET. Consensus 51-52 vs Oct final 48.0. clometrix.com/news/release-p…

1
29
Options have tended to underprice Fed days. Going into a decision they have priced an ordinary hour of Bitcoin at a 0.46% move; in the hour after, it has moved a median 0.90%, 1.5 times that, across 45 since 2021. Today they price an hour at 0.39%. nitter.gq/tramy2468/status/21234…

The Fed is talking about hiking again, and Bitcoin is pricing it in before anyone votes.
What happened:
• $BTC ~$62.9K (-0.5% 24h) after tagging ~$62.1K, still roughly 50% below the $126K peak of Oct 2025
• ETH $1,774 (+0.1%), BNB $586 (+0.3%), SOL $73.77 (-0.1%)
• Total crypto market cap ~$2.18T (-2.6%), BTC dominance 58.0%
• Fear & Greed Index: 10, deep in Extreme Fear
Why it matters:
October CPI rose 0.4%, hotter than expected, and Governor Waller said this week the Fed may need to "shock people" with a 50bp hike at the Dec. 8-9 meeting, or 25bp plus a January signal. Rate hikes drain the liquidity that risk assets live on, and crypto trades like the highest-beta part of that trade. Gold slipping to a 14-month low below $3,700 tells you this is a macro repricing, not a crypto-only story.
What the data says:
• US spot BTC ETFs saw ~$306.5M in net outflows on Nov 18, a second straight session, with IBIT alone ~$148.7M. November outflows are near $2.89B
• CoinGlass shows ~$116M in Bitcoin futures liquidated over 24 hours, ~$78M of it longs
• Public miners keep selling into AI data-center buildouts. MARA alone has sold 40,581 BTC this year
• Hashrate is holding up at about 1,010 EH/s. After a -9.13% difficulty drop last epoch, mempool .space projects about +10% at the next retarget, around Nov 26
The split is clear. Fast money is still leaving through ETFs, even as Q3 13F filings showed big banks adding IBIT.
Levels & catalysts:
• $62K is the support traders keep pointing to. Losing it brings the mid-year lows near $58K back into play
• The 200-week MA near $68K has already been lost and is now the key reclaim test
• Next: Fed speakers and the Dec. 8-9 FOMC, where the debate is 25bp versus 50bp
Bull case: extreme fear and resilient hashrate are classic late-capitulation conditions.
Bear case: a 50bp hike isn't fully priced in, and ETF demand still hasn't turned.
Takeaway: the chart is following the Fed. Watch the macro data, not the noise.
#Bitcoin #Crypto

60
On the yield side, Bitcoin and the 10-year real yield have barely moved together week to week. Over the last two years it rose in 23 of the 49 weeks the real yield rose and in 24 of the 52 weeks it fell, a correlation of -0.10. nitter.gq/ZynxBTC/status/2123475…

We have lost our minds.
I can't believe what I'm reading from some in the MSTR community right now.
For the past 6 months, I've watched yields rise across the credit spectrum, including on AAA-rated debt.
The risk-free rate keeps climbing and the Fed is likely to keep hiking.
No credit product is immune to the wider yield environment, least of all a new, variable-rate, Bitcoin-backed product like STRC.
Bitcoin credit is also highly sensitive to Bitcoin's volatility. When Bitcoin rises, the collateral behind the products grows and the credit strengthens. When Bitcoin falls, the collateral shrinks and the credit weakens.
So we have a double hit of rising yields and a falling Bitcoin price, both making Bitcoin credit less attractive.
In Strategy's case, the falling share price means the converts are trading as debt again rather than equity. That adds more claims above STRC in the capital stack and weakens it further.
Strategy could have raised STRC's rate by 0.5% or 1% to keep pace, costing $50M or $100M a year in extra dividends. Instead, it spent $2.7B on buybacks in a few short months, funded by diluting MSTR at rock-bottom prices.
It could then have sat tight and waited for Bitcoin to recover.
Rather than rewarding long-term STRC holders with a higher rate to compensate for the added risk and rising yields, Strategy has provided exit liquidity for traders and short-term holders.
Now MSTR trades below 1x mNAV and STRC has slipped to $95. The mission of cash-like volatility has failed. You can't mechanically force this thing to par and buybacks don't stimulate demand.
Don't talk to me about the institutions either. Where are they now? How have they rewarded us for sacrificing the common equity to prop up STRC? We were first to Bitcoin, and we were first to embrace Bitcoin credit.
They are here because we are here, not the other way around. They will adopt Bitcoin credit because it's the superior product and because the people embraced it first.
You don't sell out the common shareholder.
31
The dollar is in focus today. Over the last two years, Bitcoin rose in 18 of the 49 weeks the Fed's broad dollar index rose, and in 30 of the 54 weeks it fell, a weekly correlation of -0.13. A free account opens these charts back to 2017. clometrix.com/charts?utm_sou…

22
On the Michigan side, Bitcoin has tended to move more than options priced. Going into the final reading they have priced an ordinary hour at a 0.47% move; in the hour after, it has moved a median 0.71%, 1.6 times that, across 68 since 2021. nitter.gq/Mfiri4717/status/21233…

$ANT starts trading today, priced at $83 after an $81.3B IPO. Friday: $BTC options expiry and Michigan sentiment.
FOMC is Dec 8-9. Almost all officials backed another hike.
$ANT holds a premium → risk can rotate back to $BTC.
Yields keep climbing → the debut won't matter.
NFA

24
Japan's half of that has been quiet for Bitcoin. Its first 15 minutes after Japan's CPI have swung a median 0.66x a normal quarter hour across this year's 10, calmer than an ordinary 15 minutes. The biggest since 2021 was 3.17x on 18 August 2023. nitter.gq/JungleRockRes/status/2…

Today’s macro focus moves from US labor data this morning to Japan’s inflation tonight.
🇺🇸 8:30am - US Jobless Claims
🇯🇵 6:30pm - Japan Inflation Rate YoY (Oct; 2% consensus)
Both times ET.

2
32
Friday's final Michigan sentiment has grown louder for Bitcoin. Its first 15 minutes after the release swung a median 1.57x a normal quarter hour in 2021, 2.99x in 2025 and 3.24x across this year's 10. The usual since 2021 is 2.34x, across 70. clometrix.com/reports/michig…

27