

👨💼 Engineering/Finance background 🏝 FI/RE at 34 📬 Sharing my EDGE in the market to 32k+ investors. Join the Edge newsletter for FREE 👇
Joined October 2020
- Tweets17.2K
- Following240
- Followers11K
- Likes18.8K







Pinned Tweet
I spent 2 years building a stock research website. No vibe coding. No AI slop. Just me making something I think is cool.
And I want people to see it but I don't know the first thing about marketing.
If you think it's cool, a like or share would be great:
thestockinvestorsedge.com/da…


"With the Anthropic IPO done and dusted, we got yet another “Clearing Event” out of the way, which resulted in “clearing out” yet another troop of monkeys …"🥹🌳
shrubstack.com/p/aslopic-ipo…

2
392
UMich 1-year inflation expectations held in line with estimates at 4.3% in November, down from 4.7% prior, while 5-year expectations declined to 3.4% from 3.5%, also matching estimates.
◆ 1 Year Inflation Expectations: 4.3% vs. 4.3% est. (4.7% prior*)
◆ 5 Year Inflation Expectations: 3.4% vs. 3.4% est. (3.5% prior*)

2
475
University of Michigan Consumer Sentiment came in at 51 for November, below the estimate of 51.5, even as the reading rose from a previous level of 48.
◆ Consumer Sentiment: 51 vs. 51.5 est. (48 prior*)
◆ Economic Conditions: 51 vs. 51.6 est. (46.7 prior*)
◆ Consumer Expectations: 50.9 vs. 50.9 est. (48.8 prior*)

1
468
$INTU beats earnings and revenue estimates, provides weak FY27 guidance, and has agreed to sell Mailchimp to Bending Spoons for $3.68B, stock -13.4%

2
548
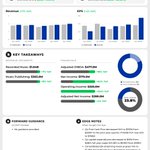
$WMG | WARNER MUSIC GROUP CORP. Q4 2026 EARNINGS HIGHLIGHTS
◆ EPS: $0.55 vs. $0.36 est. ✅
◆ Revenue: $2.00B vs. $1.91B est. ✅
◆ Adjusted OIBDA: $477M (+17.8% YoY)
◆ Net Income: $179M (+64.2% YoY)
◆ Operating Income: $320M (+123.8% YoY)
◆ Adjusted Net Income: $288M (+3.6% YoY)
Segment Performance:
◆ Recorded Music: $1.64B (+7% YoY)
◆ Music Publishing: $363M (+8% YoY)
Key Metrics:
◆ Q4 Free Cash Flow decreased 34% to $133M from $203M in the prior-year quarter; FY2026 FCF rose 42% to $766M.
◆ Q4 capital expenditures decreased to $25M from $28M; full-year capex fell 28% to $100M from $139M.
◆ Consolidated Q4 streaming revenue grew 14% to $1.28B; Recorded Music subscription streaming up 15% to $804M.
Forward Guidance:
◆ No guidance provided


$ANT officially begins trading on Nasdaq, opens at $111, +35% above the $83 listing price, and placing the valuation above $2.0T

4
507
How many signatures do you think we could get on a petition to bring Lisa Su back after she resigns from $AMD? 🤭

$AMD -8% FOLLOWING HUNTERBROOK REPORT
Hunterbrook, which says it is short AMD, alleges AMD technology is reaching a Chinese server maker on the US trade blacklist. AMD did not answer its questions, and Hunterbrook says its findings do not establish an export-law violation.

1
542
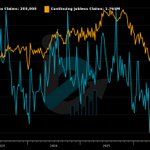
Initial jobless claims came in at 203K, above the 197K estimate, and continuing claims rose to 1.763M, above the 1.71M estimate.
◆ Initial Jobless Claims: 203K vs. 197K est. (202K prior*)
◆ Continuing Claims: 1.763M vs. 1.710M est. (1.693M prior*)

1
406
$BABA | ALIBABA GROUP HOLDING LIMITED Q3 2026 EARNINGS HIGHLIGHTS
◆ EPS: $1.21 vs. $1.71 est. ❌
◆ Revenue: $40.50B vs. $40.23B est. ✅
◆ Adjusted EBITA: $4.87B (+260.0% YoY)
◆ Net Income: $9.61B (+213.0% YoY)
◆ Operating Income: $4.34B (+443.0% YoY)
◆ Non-GAAP Net Income: $2.97B (+92.0% YoY)
Segment Performance:
◆ Alibaba E-commerce: $29.42B (+2% YoY)
◆ AI Cloud & Compute: $9.09B (+53% YoY)
◆ AI Labs & Apps: $0.66B (+51% YoY)
◆ All Others: $4.13B (-5% YoY)
Key Metrics:
◆ AI-related product revenue reached $2.67B, delivering triple-digit YoY growth for the thirteenth consecutive quarter.
◆ Capital expenditures were $7.53B in Q3 2026, up 60% YoY, driven by AI infrastructure scaling and chip pricing increases.
◆ Free cash flow was an outflow of $5.14B, versus an outflow of $3.26B in Q3 2025, due to cloud infrastructure spending.
Forward Guidance:
◆ No guidance provided

1
431
$WSM | WILLIAMS-SONOMA, INC. Q3 2026 EARNINGS HIGHLIGHTS
◆ EPS: $2.19 vs. $2.18 est. ✅
◆ Revenue: $1.99B vs. $2.00B est. ❌
◆ Net Income: $283.1M (+17.2% YoY)
◆ Operating Income: $376.9M (+18.1% YoY)
◆ Operating Expenses: $571.8M (+4.2% YoY)
◆ Operating Cash Flow: $279.0M
Segment Performance:
◆ Pottery Barn: $762.7M (+2.9% YoY)
◆ West Elm: $499.6M (+6.7% YoY)
◆ Williams Sonoma: $296.0M (+7.1% YoY)
◆ Pottery Barn Kids & Teen: $301.0M (+62.7% YoY)
Key Metrics:
◆ IEEPA tariff refund boosted GAAP gross margin by +140bps; $29.3M cost-of-goods reduction recognized in Q3 2026.
◆ Q3 2026 operating cash flow was $279M; stockholder returns totaled $253M via $163M repurchases and $90M dividends.
◆ Merchandise inventories rose 7.3% year-over-year to $1.64B as of November 1, 2026.
Forward Guidance:
◆ FY2026 net revenue growth: +4.7% to +7.2%; comps +4.0% to +6.5% (reiterated).
◆ FY2026 non-GAAP operating margin: 17.8% to 18.2% (reiterated).
◆ FY2026 non-GAAP interest income: ~$30M; effective tax rate ~26% (reiterated).
◆ FY2027 guidance will be provided in March per usual cadence.

1
434
$WMT | WALMART INC. Q4 2026 EARNINGS HIGHLIGHTS
◆ EPS: $0.65 vs. $0.64 est. ✅
◆ Revenue: $188.84B vs. $187.38B est. ✅
◆ Net Income: $4.945B (-19.5% YoY)
◆ Operating Income: $7.770B (+16.0% YoY)
◆ Operating Expenses: $40.062B (+5.2% YoY)
◆ Adjusted EBITDA: $11.786B (+8.4% YoY)
Segment Performance:
◆ Walmart U.S.: $125.0B (+3.6% YoY)
◆ Walmart International: $35.9B (+7.0% YoY)
◆ Sam's Club U.S.: $25.9B (+10.0% YoY)
Key Metrics:
◆ Global eCommerce net sales grew 17%, representing 24% of net sales; Walmart U.S. eCommerce up 23%, Sam's Club U.S. up 30%.
◆ Walmart U.S. comp sales +2.9%; ~125 bps headwind from pharmacy deflation related to maximum fair price regulation.
◆ Membership and other income grew 20%; global membership fee revenue grew 17%; Walmart U.S. membership and other income up 43%.
Forward Guidance:
◆ FY27 net sales (cc): increase 4.9% to 5.2% (raised from 4.0%-5.0%)
◆ FY27 adjusted operating income (cc): increase 8.0% to 8.6% (raised from 7.0%-8.5%)
◆ FY27 adjusted EPS: $2.84 to $2.89 (raised from $2.80-$2.87)
◆ FY27 capital expenditures: approximately 4.0% of net sales (unchanged from prior update)

CMG Venture Group retweeted
$PANW | PALO ALTO NETWORKS, INC. Q1 2027 EARNINGS HIGHLIGHTS
◆ EPS: $1.05 vs. $0.97 est. ✅
◆ Revenue: $3.44B vs. $3.31B est. ✅
◆ Net Income: $482M (+44.3% YoY)
◆ Operating Income: $96M (-68.9% YoY)
◆ Operating Expenses: $2.25B (+47.1% YoY)
◆ Operating Cash Flow: $1.93B (+9.0% YoY)
Segment Performance:
◆ Product: $595M (+37% YoY)
◆ Subscription and Support: $2.85B (+40% YoY)
Key Metrics:
◆ Adjusted free cash flow was $1.937B in Q1 FY2027, up from $1.713B a year ago; margin was 56.2%.
◆ Free cash flow (non-GAAP) was $1.842B in Q1 FY2027 vs. $1.687B in Q1 FY2026.
◆ NGS ARR reached $9.73B, up 66% YoY; remaining performance obligations grew 35% to $21.0B.
Forward Guidance:
◆ Q2 FY2027 total revenue: $3.530B-$3.550B, up 36%-37% YoY.
◆ Q2 FY2027 NGS ARR: $10.20B-$10.22B, up 61% YoY.
◆ FY2027 total revenue: $14.52B-$14.57B, up 26%-27% YoY; non-GAAP operating margin 29.5%.
◆ FY2027 diluted non-GAAP EPS: $4.26-$4.30; adjusted free cash flow margin 38.0%.

$PANW | PALO ALTO NETWORKS, INC. Q1 2027 EARNINGS HIGHLIGHTS
◆ EPS: $1.05 vs. $0.97 est. ✅
◆ Revenue: $3.44B vs. $3.31B est. ✅
◆ Net Income: $482M (+44.3% YoY)
◆ Operating Income: $96M (-68.9% YoY)
◆ Operating Expenses: $2.25B (+47.1% YoY)
◆ Operating Cash Flow: $1.93B (+9.0% YoY)
Segment Performance:
◆ Product: $595M (+37% YoY)
◆ Subscription and Support: $2.85B (+40% YoY)
Key Metrics:
◆ Adjusted free cash flow was $1.937B in Q1 FY2027, up from $1.713B a year ago; margin was 56.2%.
◆ Free cash flow (non-GAAP) was $1.842B in Q1 FY2027 vs. $1.687B in Q1 FY2026.
◆ NGS ARR reached $9.73B, up 66% YoY; remaining performance obligations grew 35% to $21.0B.
Forward Guidance:
◆ Q2 FY2027 total revenue: $3.530B-$3.550B, up 36%-37% YoY.
◆ Q2 FY2027 NGS ARR: $10.20B-$10.22B, up 61% YoY.
◆ FY2027 total revenue: $14.52B-$14.57B, up 26%-27% YoY; non-GAAP operating margin 29.5%.
◆ FY2027 diluted non-GAAP EPS: $4.26-$4.30; adjusted free cash flow margin 38.0%.
Pending home sales fell 4.7% month-over-month in October, below the estimate of -2.0%, while the year-over-year reading dropped to -16.7% against an estimate of -6.0%, the lowest since August 2023.
◆ Pending Home Sales (MoM): -4.7% vs. -2.0% est. (-7.2% prior*)
◆ Pending Home Sales (YoY): -16.7% vs. -6.0% est. (-11.3% prior*)

1
401
October Housing Starts came in at 1.309M, above estimates of 1.25M, with month-over-month growth of 9.9% against an estimate of -1.7%.
◆ Housing Starts: 1.309M vs. 1.250M est. (1.221M prior*)
◆ Housing Starts (MoM): 9.9% vs. -1.7% est. (-5.2% prior*)

408
U.S. building permits came in at 1.295M in October 2026, below the estimate of 1.38M and the lowest reading since May 2020.
◆ Building Permits: 1.295M vs. 1.380M est. (1.398M prior*)
◆ Building Permits (MoM): -7.4% vs. -2.7% est. (-0.4% prior*)

1
1
402
$TGT | TARGET CORPORATION Q3 2026 EARNINGS HIGHLIGHTS
◆ EPS: $2.65 vs. $2.08 est. ✅
◆ Revenue: $27.07B vs. $26.50B est. ✅
◆ Net Income: $1.211B (+75.8% YoY)
◆ Operating Income: $1.672B (+76.4% YoY)
◆ SG&A Expenses: $5.922B (+7.0% YoY)
◆ H1+Q3 Operating Cash Flow: $5.727B (+64.3% YoY)
Segment Performance:
◆ Food & Beverage: $6.406B (+6.6% YoY)
◆ Household Essentials: $4.747B (+4.5% YoY)
◆ Hardlines (Fun 101): $4.046B (+3905.9% YoY)
◆ Home Furnishings & Décor: $4.007B (+2.5% YoY)
Key Metrics:
◆ Tariff refunds of $301M pretax boosted Q3 gross margin by 1.1 pp, contributing $228M to net earnings and $0.50 to EPS.
◆ Comparable sales rose 5.6% in Q3 2026, driven by 5.0% traffic growth and 9.8% comparable digital sales growth.
◆ Fun 101 (Hardlines) net sales grew nearly 27%; Beauty grew more than 9%; Food and Beverage grew nearly 7% versus prior year.
Forward Guidance:
◆ FY2026 net sales growth: ~6%, raised one percentage point above prior guidance range.
◆ FY2026 operating income margin rate: ~6.2%, including ~1.1 pp benefit from tariff refunds recognized to date.
◆ FY2026 GAAP and Adjusted EPS guidance: $10.65 to $11.40, including ~$2.14 in tariff refund benefits; excludes any future refunds.
◆ FY2027 capital expenditures: expected between $5B and $6B.

1
437
$LOW | LOWE'S COMPANIES, INC. Q3 2026 EARNINGS HIGHLIGHTS
◆ EPS: $3.10 vs. $2.88 est. ✅
◆ Revenue: $22.76B vs. $22.39B est. ✅
◆ Net Income: $1.67B (+3.5% YoY)
◆ Operating Income: $2.58B (+3.8% YoY)
◆ Operating Expenses: $4.92B (+10.5% YoY)
◆ H1+Q3 Operating Cash Flow: $8.69B (+4.7% YoY)
Key Metrics:
◆ Q3 comparable sales rose 1.8%, driven by 17.4% online sales growth and solid Pro and home services performance.
◆ Acquisition-related intangible amortization for FBM and ADG totaled $96M pre-tax in Q3, excluded from adjusted EPS.
◆ Dividends paid totaled $701M in Q3 2026; Lowe's maintained its Dividend Aristocrat and Dividend King status.
Forward Guidance:
◆ FY2026 total sales: ~$92.5B (raised from ~$92.0B previously)
◆ FY2026 comparable sales: ~+0.5% YoY (raised from flat previously)
◆ FY2026 GAAP operating margin: ~11.1%; adjusted operating margin: ~11.5% (each down ~10bps from prior guidance)
◆ FY2026 adjusted diluted EPS: ~$12.25; GAAP diluted EPS: ~$11.75

*The $NVDA Board unanimously accepted his resignation and does not intend to reinstate Jensen as CEO
3
722