

Build Options Apps with your AI Agent - Download cvforge - it’s Free! Options data included! 👇
Vol Surface
Joined May 2020
- Tweets15.7K
- Following1
- Followers14.2K
- Likes9.6K




Pinned Tweet
optionsdata.ai beta is live (join below to test it out!)
It is an options data primitives API for use with your agents.
- Options Chain (bid/ask/last/greeks/iv/volume/oi)
- Time and Sales
API available via REST/WebSocket/MCP.
Testing it is free and I would love your feedback as I improve it before black friday release.
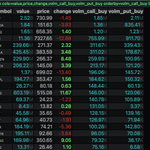
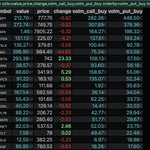
Top 20 by Volume of Put Buys
🚨check out the optionsdata.ai API beta - free until release on Black Friday! 🚨
$SPY
$QQQ
$SPX
$IWM
$NVDA
$AMD
$AAPL
$VIX
$TSLA
$SPCX
$AMZN
$MU
$NFLX
$TLT
$IBIT
$INTC
$SOXL
$XLF
$XSP
$SOFI
Command: flow cols=value,price,change,volm_call_buy,volm_put_buy orderby=volm_put_buy limit=20


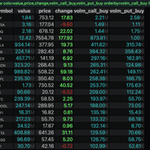
Top 20 by Volume of Call Buys
🚨dont forget to check try out our new API @ optionsdata.ai during the free beta to see if it works for you before black friday release 🚨
$SPY
$NVDA
$QQQ
$SPX
$IWM
$TSLA
$AMZN
$SPCX
$MU
$AAPL
$TLT
$AMD
$VIX
$PCG
$IBIT
$SLV
$GDX
$MSTR
$AVGO
$GME
Command:
flow cols=value,price,change,volm_call_buy,volm_put_buy orderby=volm_call_buy limit=20

Convex Value retweeted

SPX intraday note — November 19, 2026
1:49 p.m. ET | Elevated volatility, negative gamma, 7,200–7,250 in focus
SPX is trading around 7,229, approximately the midpoint of the supplied expected-move band. The immediate reference levels remain 7,200 below and 7,250 above, but the latest dataset argues against treating that bracket as a dependable afternoon pin.
Current setup
MeasureLatest supplied readingInterpretationATM implied volatility~26.9%, versus ~11.4% at yesterday’s closeA sharp repricing of near-term risk; the second renewed volatility spike this weekRemaining expected move±~71.7 points over approximately 2 hours 13 minutesIndicative band of ~7,157–7,300—not a hard boundaryNet GEXApproximately −189, versus −188 yesterdayAggregate gamma exposure remains negative; units and methodology were not suppliedRegime persistenceSix consecutive sessions, November 12–19Longest negative-GEX stretch in the supplied tracking historyLargest gamma concentrations7,200 (~20) and 7,250 (~18)Key nearby levels; wall magnitudes alone do not establish reliable support or resistanceData coverage7,090–7,370The supplied analysis reports no artifact-driven strike exclusions
What changes from the 13:30 checkpoint
The earlier checkpoint favored a pin inside 7,200–7,250 because of a locally positive-gamma bracket. This update reports substantially negative aggregate GEX.
Those readings are not necessarily contradictory: a locally positive strike cluster can exist within a negative aggregate profile. However, without matching the two sources’ coverage, sign conventions, and calculations, they should not be treated as directly comparable.
The practical revision is to lower confidence in the pin thesis—not to assume that the local bracket has disappeared. Elevated implied volatility and the supplied negative-GEX reading favor keeping a wider range of outcomes in view.
Rest-of-day map
Above 7,250: Sustained acceptance would strengthen the recovery case. The earlier checkpoint’s 7,275–7,280 target remains the first reference, with ~7,300 near the upper edge of the latest expected-move band.
Between 7,200 and 7,250: Two-way trading remains possible, but the bracket is a working range rather than a dependable containment zone.
Below 7,200: Sustained trade would weaken the bracket thesis. A break of the earlier ~7,195 low would bring the prior 7,160–7,180 downside zone into focus, close to the latest band’s ~7,157 lower edge.
Main lesson from the morning
Put selling did not prevent the break below 7,250. It should therefore remain a positioning input, not a standalone floor or a necessary warning signal before another decline.
The central question into the close is whether price can hold 7,200 and reclaim 7,250—not whether sold puts alone imply support.#SPX #0dte @ConvexValue @doc_mcgraw
Convex Value retweeted

$SPY $QQQ $SPX
Noted Spot Down Vol Down yesterday - nice 90 pt rally so far on regime shift; We're not out of the woods yet.
Market Data from @ConvexValue
-Volatility expectations (Term structure) are moving back up; yellow = today, red = yesterday
-Overnight Straddle is 81 giving us a range of [7242, 7403]
-Morning Straddle is 65 from 7405 this AM
-Weekly straddle (135 pts) is [7426, 7698]
-ON Volumes are 50% above average; 20% more call volume than put volume; 7500 calls and 7300puts highest volume
Net Exposure (SPX) from @OptionsDepth
-Pivot is 7378
-Upside Targets are 7395, 7410, 7425, 7435, 7450, 7465, 7480
-Downside Targets are 7360, 7340, 7320, 7310, 7300, 7285
Thoughts
-Upside Pivot 7452 ES (7433SPX); Downside Pivot 7341 ES (7322 SPX)
-Upside Targets are 7473 and 7487 ES; Downside Targets are 7341 and 7313 ES
-Charm has a large impact the next ~36 hours
-RV Spaces at 1145 EST!


Top 20 by Volume of Call Buys
🚨dont forget to check try out our new API @ optionsdata.ai during the free beta to see if it works for you before black friday release 🚨
$SPY
$NVDA
$QQQ
$SPX
$IWM
$TSLA
$AMZN
$SPCX
$MU
$AAPL
$TLT
$AMD
$VIX
$PCG
$IBIT
$SLV
$GDX
$MSTR
$AVGO
$GME
Command:
flow cols=value,price,change,volm_call_buy,volm_put_buy orderby=volm_call_buy limit=20
Top 20 by volume of put buys ⚠️
(reminder: check out optionsdata.ai during free beta before we release on black friday!)
$SPY
$QQQ
$SPX
$IWM
$NVDA
$VIX
$AAPL
$IBIT
$TSLA
$MU
$AMD
$MSFT
$SPCX
$XLF
$INTC
$XSP
$MSTR
$BTDR
$KRE
$SOXL
Command:
flow cols=value,price,change,volm_call_buy,volm_put_buy orderby=volm_put_buy limit=20


Convex Value retweeted
$SPY $QQQ
Market Data from @ConvexValue
-Volatility expectations (Term structure) are moving back up; yellow = today, red = yesterday
-Overnight Straddle is 92 giving us a range of [7248, 7432]
-Morning Straddle is 61 from 7360 this AM
-Weekly straddle (135 pts) is [7426, 7698]
-ON Volumes are moderately above average; near equal volume on puts and calls; 7500 calls and 7200 puts highest volume
Net Exposure (SPX) from @OptionsDepth
-Pivot is 7321
-Upside Targets are 7335, 7350, 7370, 7395, 7410, 7420, 7435
-Downside Targets are 7310, 7295, 7275, 7260, 7235, 7210
Thoughts
-Upside Pivot 7404 ES (7384 SPX); Downside Pivot 7292 ES (7272 SPX)
-Upside Targets (care for reversion) are 7433 & 7496; Downside Targets are 7237 and 7203

SPX 0dte overnight volume
🚨don't forget to test out optionsdata.ai during our free beta before black friday release! 🚨
7500 Calls
Command: joy spx volm exp=1 rng=10 hb

SPX 0dte overnight volume:
(if you haven't yet - give the optionsdata.ai beta a shot! its free while in beta!)
7600 calls
Command: joy spx volm exp=1 rng=5 hb


Top 20 by volume of put buys ⚠️
(reminder: check out optionsdata.ai during free beta before we release on black friday!)
$SPY
$QQQ
$SPX
$IWM
$NVDA
$VIX
$AAPL
$IBIT
$TSLA
$MU
$AMD
$MSFT
$SPCX
$XLF
$INTC
$XSP
$MSTR
$BTDR
$KRE
$SOXL
Command:
flow cols=value,price,change,volm_call_buy,volm_put_buy orderby=volm_put_buy limit=20
Top 20 ranked by volume of call buys:
(Check out optionsdata.ai for an API exposing volume of call and put buys and sells 👀. Free for now during testing - will release on black friday.)
$SPY
$NVDA
$QQQ
$SPX
$TSLA
$IWM
$SPCX
$AMZN
$AMD
$AAPL
$MU
$VIX
$INTC
$GOOGL
$SOFI
$SOXL
$RIOT
$META
$TQQQ
$IBIT
Command:
flow cols=value,price,change,volm_call_buy,volm_put_buy orderby=volm_call_buy limit=20


Convex Value retweeted
$SPY $QQQ
Choppy Overnight PA within yesterday's candle (and slight undercut)
Market Data from @ConvexValue
-Volatility expectations (Term structure) are moving back up; yellow = today, red = yesterday
-Overnight Straddle is 71 giving us a range of [7345, 7487]
-Morning Straddle is 58 from 7418 this AM
-Weekly straddle (135 pts) is [7426, 7698]
-ON Volumes are slightly above average; near equal volume on puts and calls; 7500 calls and 7300 puts highest volume
Net Exposure (SPX) from @OptionsDepth
-Pivot is 7434
-Upside Targets are 7450, 7465, 7480, 7495, 7510, 7520, 7550
-Downside Targets are 7410, 7395, 7375, 7365, 7350
Thoughts
-Upside Pivot 7476 ES (7457 SPX); Downside Pivot 7363ES (7344 SPX)
-Overnight Levels


SPX 0dte overnight volume:
(if you haven't yet - give the optionsdata.ai beta a shot! its free while in beta!)
7600 calls
Command: joy spx volm exp=1 rng=5 hb
SPX 0dte overnight volume:
(Check out optionsdata.ai - it is free during beta! - includes live volume to create visuals like this)
Puts > Calls
Strike 7500 Puts
Command: joy spx volm exp=1 rng=5 hb

Convex Value retweeted
$SPY $QQQ $SPX
Clean PA overnight - several setups offered; Testing structure to downside
Market Data from @ConvexValue
-Volatility expectations (Term structure) is moving back up; yellow = today, red = yesterday
-Overnight Straddle is 63 giving us a range of [7498, 7624]
*Tested ON Low overnight*
-Morning Straddle is 51 from 7507 this AM
-Weekly straddle (135 pts) is [7426, 7698]
-ON Volumes are ~80% above average; equal volume on puts and calls; 7600 calls and 7500 puts highest volume
Net Exposure (SPX) from @OptionsDepth
-Pivot is 7517
-Upside Targets are 7530, 7550, 7565, 7580, 7595, 7615, 7635
-Downside Targets are 7500, 7485, 7475, 7465, 7445
Thoughts
-Upside Pivot 7593 ES (7573 SPX); Downside Pivot 7503 ES (7483 SPX)


Convex Value retweeted
@macrocapadvisor Macro Terminal MVP: 50+ data feeds (so far), free & paid API's. Pretty amazing what you can build with today's tools... 🖥️
@grok @bot @OpenAI @claudeai
@tradingview @Cboe @Tradytics @FINRA @SqueezeMetrics @USTreasury @CFTC @Cboe @CFTC @ConvexValue @CharlesSchwab @MenthorQpro @tastytrade @CNBC @AlpacaHQ @USOCC @EIAgov @eWhispers @BLS_gov @BEA_News @uscensusbureau


Convex Value retweeted
$SPY $QQQ
Week ahead is out: yamtrades.substack.com/p/pos…
Market Data, skew dashboards from @ConvexValue
SPX & VIX positioning from @OptionsDepth
Market Structure - Two ways of looking at it
1) Volume Profile - It might not feel like it, but market structure held where it needed to on Friday. Might we see further downside - sure, but for now, structure is intact across ES/NQ.
2) Weekly MAs - We held the 21W EMA; close under and historically (since 2022), we've seen the weekly 50SMA or weekly 100SMA.
Realized Volatility
@tony_mansour and I are hosting a spaces on 11/19: nitter.gq/i/spaces/1nJOLQlQVZkxR…
Realized Volatility PT. 7 - Does this even matter?
-I know this is a burning question for each and every one of you! We might answer it!
3) RV YTD Analog - When I made this, I had no clue what to expect but it sure is interesting to see seasonal volatility.
Positioning & Skew
4) VIX positioning after this VIXEX looks like VIX_crush.exe; Index and single name skew is heavily skewed to the downside (Sorry I only get 4 pictures)
Enjoy your weekends.
If the week ahead or daily posts are of any value, please like/repost.


