

Not Today | Gem coin hunter | Seed Investor | Margin and Spot Trader|
Joined February 2014
- Tweets2.5K
- Following1.8K
- Followers72.3K
- Likes24.1K


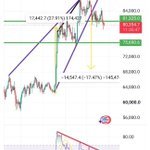


Wedge Breakout: $GOLD Retests Ascending Trendline Support
Following up on our previous study. In our last review, we observed Gold consolidating above its multi-year purple ascending trendline support following a breakout from the black descending wedge pattern.
Since then, price action experienced a temporary pull-back, testing key technical boundaries near the purple ascending trendline and underlying support zones. Currently, price action is consolidating near this critical support boundary.
A sustained hold above the purple ascending trendline support could potentially allow price action to regain upward momentum toward upper technical resistance boundaries.
To preserve this wedge breakout structure, maintaining price action above the underlying purple ascending trendline and lower support floors remains the most critical factor.
⚠️ Not financial advice.
#Gold #XAUUSD #Macro #TechnicalAnalysis

🚨 THIS WEEK'S KEY DEVELOPMENTS
✍️ Tuesday
• CBDC Conference kicks off in Amsterdam. The two-day event will focus on global crypto regulations, stablecoins, and digital currency infrastructures.
• Ethereum “Hoodi” Testnet launch
✍️ Wednesday
• Fed Interest Rate Decision — 21:00
Expectation: 4% | Previous: 4%
• Fed Chair Warsh Remarks — 21:30
✍️ Thursday
• US Core PCE (YoY) — 15:30
• US GDP Data — 15:30
• ECB Interest Rate Decision — 16:15
Expectation: 2.65% | Previous: 2.65%
✍️ Friday
• Bank of Japan (BoJ) Interest Rate Decision — 06:00
Expectation: 1.25% | Previous: 1.25%
• Fed Member Daly Remarks — 19:00
⚠️ Not financial advice.
#Crypto #Macro #Fed #ECB #Economy
Macro Structure: Bitcoin Dominance ( $BTC.D ) Consolidates Within Wedge
Following up on our previous study. In our last review, we observed Bitcoin Dominance ($BTC.D) trading inside a black ascending wedge pattern after rebounding from foundational support levels.
Since then, price action moved upward toward intermediate yellow horizontal resistance boundaries and is currently consolidating near the upper boundary of the wedge structure.
A breakdown below the lower black ascending trendline could potentially trigger a deeper decline toward the lower green horizontal support floors, as indicated by the blue downward projection arrows.
Conversely, to maintain upward momentum within this structure, preserving dominance above the lower black trendline and immediate green horizontal support floor remains the most critical factor.
⚠️ Not financial advice.
#BTC #Bitcoin #Crypto #MarketCap

Structural Breakdown: $BTC Tests Reclaimed Support Floor
Following up on our previous study. In our last review, we observed Bitcoin ($BTC) consolidating inside a purple ascending wedge structure while holding near major technical support boundaries.
Since then, price action broke down below the lower purple ascending trendline, pulling back toward the underlying green horizontal support floor. Additionally, RSI continues to move under a red descending resistance trendline. Currently, price action is consolidating directly at this green horizontal support level.
A sustained hold above this green horizontal support floor could potentially allow price action to attempt a recovery retest back toward the lost purple ascending trendline. However, losing this key support floor could risk a deeper downside expansion toward lower green horizontal support zones, as indicated by the yellow downward projection arrow.
To prevent further downside momentum, preserving price action above the immediate green horizontal support floors remains the most critical factor.
⚠️ Not financial advice.
#Bitcoin #BTC #Crypto #MarketAnalysis


Structural Breakdown: $BTC Tests Reclaimed Support Floor
Following up on our previous study. In our last review, we observed Bitcoin ( $BTC ) consolidating inside a purple ascending wedge structure while holding near major technical support boundaries.
Since then, price action broke down below the lower purple ascending trendline, pulling back toward the underlying green horizontal support floor. Additionally, RSI continues to move under a red descending resistance trendline. Currently, price action is consolidating directly at this green horizontal support level.
A sustained hold above this green horizontal support floor could potentially allow price action to attempt a recovery retest back toward the lost purple ascending trendline. However, losing this key support floor could risk a deeper downside expansion toward lower green horizontal support zones, as indicated by the yellow downward projection arrow.
To prevent further downside momentum, preserving price action above the immediate green horizontal support floors remains the most critical factor.
⚠️ Not financial advice.
#Bitcoin #BTC #Crypto #MarketAnalysis

Wedge Breakout: $Gold Retests Ascending Trendline Support
Following up on our previous study. In our last review, we observed Gold consolidating above its multi-year purple ascending trendline support following a breakout from the black descending wedge pattern.
Since then, price action experienced a temporary pull-back, testing key technical boundaries near the purple ascending trendline and underlying moving averages. Currently, price action is consolidating near this critical support zone.
A sustained hold above the purple ascending trendline support could potentially allow price action to regain upward momentum toward upper technical resistance boundaries.
To preserve this wedge breakout structure, maintaining price action above the underlying purple ascending trendline and lower black horizontal support floors remains the most critical factor.
⚠️ Not financial advice.
#Gold #XAUUSD #Macro

Structural Breakdown: $BTC Tests Reclaimed Support Floor
Following up on our previous study. In our last review, we observed Bitcoin ( $BTC ) consolidating inside a purple ascending wedge structure while holding near major technical support boundaries.
Since then, price action broke down below the lower purple ascending trendline, pulling back toward the underlying green horizontal support floor. Additionally, RSI continues to move under a red descending resistance trendline. Currently, price action is consolidating directly at this green horizontal support level.
A sustained hold above this green horizontal support floor could potentially allow price action to attempt a recovery retest back toward the lost purple ascending trendline. However, losing this key support floor could risk a deeper downside expansion toward lower green horizontal support zones, as indicated by the yellow downward projection arrow.
To prevent further downside momentum, preserving price action above the immediate green horizontal support floors remains the most critical factor.
⚠️ Not financial advice.
#Bitcoin #BTC #Crypto #MarketAnalysis
Wedge Breakdown: $BTC Retests Critical Support Band
Following up on our previous study. In our last review, we observed $BTC forming higher highs along the black ascending trendline while underlying momentum weakened along the descending red RSI resistance line, signaling an active bearish divergence.
Additionally, price action developed an ascending wedge structure bounded by the purple trendlines. The expected breakdown has now materialized as price broke beneath the lower purple wedge boundary, driving a downward pull toward the foundational green horizontal support floor and the Bull Market Support Band, as indicated by the yellow downward arrow.
Concurrently, RSI momentum remains suppressed beneath the red descending resistance line, confirming that bearish divergence forces continue to weigh on price action.
To prevent a deeper corrective wave and preserve the macro bullish structure, holding above the immediate green horizontal support floor remains the most critical factor.
⚠️ Not financial advice.
#BTC #Bitcoin #Crypto #TechnicalAnalysis

Macro Structure: $ENA Retests Reclaimed Support Floor
Following up on our previous study. In our last review, we observed Ethena ( $ENA ) expanding strongly above the purple descending trendline and breaking through intermediate technical levels.
Since then, price action reached upper levels near yellow horizontal resistance boundaries before undergoing a corrective pull-back, retesting the reclaimed green horizontal support floor. Currently, price action is holding above this key horizontal support zone.
A sustained hold above this green horizontal support floor could potentially allow price action to regain upward momentum toward upper yellow horizontal resistance boundaries.
To maintain this macro structure, preserving price action above the underlying green horizontal support floors remains the most critical factor.
⚠️ Not financial advice.
#ENA #Ethena #Crypto #Altcoins #DeFi

Macro Breakout: $ENA Converts Resistance into Green Support
🔷 Following up on our previous study. In our last review, we highlighted that $ENA was consolidating above its black primary support zone while compressing beneath the purple descending trendline.
✍️ That bottoming structure has now catalyzed a powerful upward expansion. ENA decisively broke out above the purple descending resistance, ending the prolonged downtrend.
📈 Driven by the vertical surge illustrated by the blue upward arrow, price action cleared the former yellow horizontal resistance and successfully flipped it into a solid green support floor.
Bulls remain firmly in control as price action trends toward the upper yellow horizontal resistance boundaries. Sustaining structure above the newly established green support keeps the bullish breakout scenario intact.
⚠️ Not financial advice.
#ENA #Ethena #Crypto #Altcoins #Web3

Structural Retest: Hyperliquid Retests Reclaimed Support Floor
Following up on our previous study. In our last review, we observed Hyperliquid ( $HYPE ) expanding strongly toward upper technical resistance boundaries.
Since then, price action reached local high peaks before undergoing a corrective pull-back, retesting the reclaimed green horizontal support floor.
A sustained hold above this green horizontal support floor could potentially allow price action to regain momentum toward upper yellow horizontal resistance boundaries.
To maintain this recovery structure, preserving price action above the underlying green horizontal support floors remains the most critical factor.
⚠️ Not financial advice.
#Hyperliquid #HYPER #Crypto #Altcoins #DeFi

Massive Expansion: $HYPE Reclaims Resistance as Green Support
Following up on our previous study. In our last review, we noted that $HYPE was testing its foundational green horizontal support floor, searching for a strong reaction from this demand region.
Gathering strength from this underlying support, price action executed an aggressive vertical expansion, as highlighted by the blue upward arrow. Driven by this intense buying momentum, price decisively reclaimed multiple overhead resistance boundaries.
In accordance with our structural principles, these breached resistance levels have been converted into solid green horizontal support floors. Price action is now challenging the primary yellow horizontal resistance boundary.
Sustaining price action above the newly established green horizontal support floors remains the most vital factor for maintaining this bullish trajectory.
⚠️ Not financial advice.
#HYPE #Hyperliquid #Crypto #Altcoins #Web3

Structural Recovery: $SOL Retests Reclaimed Support Floor
Following up on our previous study. In our last review, we observed Solana ($SOL) holding above its foundational weekly support zone.
Since then, price action experienced a strong recovery wave, as projected by the blue vertical upward arrow (+86.83%), breaking above immediate technical levels. After testing higher local levels near yellow horizontal resistance boundaries, price action is currently undergoing a pull-back, retesting the reclaimed green horizontal support floor.
A sustained hold above this green horizontal support floor could potentially allow price action to regain momentum toward upper yellow horizontal resistance boundaries.
To maintain this structural recovery, preserving price action above the underlying green horizontal support floors remains the most critical factor.
⚠️ Not financial advice.
#Solana #SOL #Crypto #Altcoins #Layer1

📉 $SOL continues to trade just above a major weekly support zone after an extended correction. Buyers are still defending this area, but the lack of strong momentum shows that confirmation is needed before calling a trend reversal.
As long as the current support holds, a recovery toward the first resistance zone remains possible. However, losing this level on a weekly closing basis could accelerate selling pressure and open the door to lower support levels.
For now, this is one of the most important technical areas for Solana, and the upcoming weekly close will be worth watching closely.
⚠️ Not financial advice.
#Solana #SOL #Bitcoin #Crypto #Altcoins

Macro Breakdown: USDT Dominance ( $USDT.D ) Tests Resistance Below Trendline
Analyzing the USDT Dominance ($USDT.D) weekly chart structure, price action recently broke down below the major black ascending trendline.
Following this structural breakdown, dominance declined toward the green horizontal support floor before attempting a temporary relief bounce. Currently, dominance is undergoing a pull-back retest toward the overhead yellow horizontal resistance boundary and the lost black ascending trendline.
A failure to reclaim the yellow horizontal resistance boundary and black trendline could potentially trigger a continuation move toward lower green horizontal support floors.
To prevent further downside expansion, reclaiming and holding above the yellow horizontal resistance boundary remains the most critical factor for dominance bulls.
⚠️ Not financial advice.
#USDT #USDTDominance #Crypto #MarketCap

Macro Structure: Bitcoin Dominance ( $BTC.D ) Consolidates Within Wedge
Analyzing the Bitcoin Dominance ($BTC.D) weekly chart structure, price action is currently trading inside a black ascending wedge pattern after experiencing a major drop from peak levels.
Recently, market dominance rebounded from the lower green horizontal support floor and the lower black ascending trendline, pushing upward to test intermediate yellow horizontal resistance boundaries. Currently, dominance is consolidating near the upper boundary of the wedge structure.
A breakdown below the lower black ascending trendline could potentially trigger a deeper decline toward the lower green horizontal support floors, as indicated by the blue downward projection arrows.
Conversely, to maintain upward momentum within this structure, preserving dominance above the lower black trendline and immediate green horizontal support floor remains the most critical factor.
⚠️ Not financial advice.
#BTC #Bitcoin #Crypto #MarketCap

Wedge Breakout: Gold Retests Ascending Trendline Support
Analyzing the Gold weekly chart structure, price action recently broke out above the black descending wedge resistance pattern.
Following the breakout, price action initiated a strong expansion move toward higher technical levels before undergoing a corrective pull-back to retest the multi-year purple ascending trendline support. Currently, price action is consolidating along this key purple trendline support zone.
A sustained hold above the purple ascending trendline support could potentially allow price action to regain upward momentum and target upper resistance boundaries.
To preserve this bullish wedge breakout structure, maintaining price action above the underlying purple ascending trendline and lower black horizontal support floors remains the most critical factor.
⚠️ Not financial advice.
#Gold #XAUUSD #Commodities #Macro #TechnicalAnalysis

Trend Breakout: $ARPA Retests Reclaimed Support Floor
Analyzing the ARPA Chain (ARPA) weekly chart structure, price action recently broke out above the major purple descending trendline resistance.
Following the trendline breakout, price action expanded upward as projected by the light blue vertical arrow, reaching for upper yellow horizontal resistance boundaries. Currently, price action is undergoing a consolidation pull-back, retesting the newly reclaimed green horizontal support floor.
A sustained hold above this green horizontal support floor could potentially allow price action to regain momentum toward upper yellow horizontal resistance boundaries.
To maintain this breakout structure, preserving price action above the underlying green horizontal support floors remains the most critical factor.
⚠️ Not financial advice.
#ARPA #ARPAChain #Crypto #Altcoins #TechnicalAnalysis

Trend Continuation: $ARPA Clears Purple Resistance
Following up on our previous study. In our last review, we observed $ARPA consolidating near the foundational green horizontal support floor, preparing to test the descending purple trendline.
Buyers have successfully absorbed the selling pressure and forced a decisive breakout above the descending purple trendline. As highlighted by the blue vertical upward arrow, price action has reclaimed the key green horizontal support floor and is expanding higher.
Driven by this renewed bullish momentum, price action is actively trending toward the overhead yellow horizontal resistance boundaries.
To sustain this upward expansion and validate the breakout structure, maintaining price action above the newly reclaimed green horizontal support floor remains the most critical factor.
⚠️ Not financial advice.
#ARPA #Crypto #Altcoins #Web3

Range Consolidation: $SPCX Retests Reclaimed Support Floor
Analyzing the Space X (SPCX) daily chart structure, price action recently rebounded from lower green horizontal support floors and expanded upward to test overhead yellow horizontal resistance boundaries.
After facing temporary rejection at upper technical levels, price action underwent a corrective pull-back to test the immediate green horizontal support floor, where buyers stepped in to initiate a strong recovery candle. Currently, price action is consolidating near intermediate horizontal pivot levels.
A sustained hold above the immediate green horizontal support floor could potentially allow price action to regain momentum toward upper yellow horizontal resistance boundaries.
To maintain this recovery structure, preserving price action above the underlying green horizontal support floors remains the most critical factor.
⚠️ Not financial advice.
#SPCX #SpaceX #Crypto #Perpetual #TechnicalAnalysis

Structural Recovery: $BNB Reclaims Major Support Level
Following up on our previous study. In our last review, we observed BNB ($BNB) holding foundational green horizontal support floors near the lower black ascending channel boundary.
Since then, price action experienced a strong expansion wave, breaking above intermediate structural levels and re-entering the black ascending channel structure before facing temporary rejection near yellow horizontal resistance boundaries. Currently, price action is retesting the reclaimed green horizontal support floor.
A sustained hold above this green horizontal support floor could potentially allow price action to challenge the lower black ascending trendline and move toward upper yellow horizontal resistance boundaries.
To maintain this structural recovery, preserving price action above the underlying green horizontal support floors remains the most critical factor.
⚠️ Not financial advice.
#BNB #Binance #Crypto #Altcoins #BSC

📈 $BNB is no longer trending it's testing whether long-term demand is strong enough to stop the decline.
Compared with my previous analysis, the weekly structure has weakened after losing the ascending channel. More importantly, the breakdown wasn't followed by a successful reclaim of the channel, confirming it as a failed retest rather than a false breakdown. Since then, price has shifted into a low-volatility range directly above major weekly support, while selling pressure has gradually lost momentum.
The current data doesn't support a bullish reversal yet. RSI would naturally be expected to stabilize after the prolonged decline, and MACD momentum should continue flattening as the market compresses. The next structural improvement begins only if buyers reclaim the first overhead resistance; until then, this remains a base-building phase inside a broader corrective trend. 📊
⚠️ Not financial advice.
#Bitcoin #Ethereum #Altcoins #Crypto

🔷️ Institutional Accumulation: Strategy, Strive & Bitmine Expand $Crypto Holdings
Analyzing recent institutional activity, major corporate entities continue to expand their digital asset treasuries through aggressive market acquisitions.
Strategy acquired an additional 267 Bitcoin ($BTC) last week, further reinforcing its institutional treasury model. Meanwhile, Strive purchased 1,223 $BTC, expanding its total balance sheet holdings to 36,818 Bitcoins.
In the Ethereum ecosystem, Bitmine announced the acquisition of 12,535 $ETH over the past week, driving its total corporate treasury holdings to 6.04 million Ether ($ETH).
Sustained institutional inflows and corporate balance sheet expansions could potentially strengthen market absorption capacity and support broader long-term market structure.
To maintain positive market sentiment, continued institutional demand and holding stability across major corporate treasuries remain critical factors.
⚠️ Not financial advice.
#BTC #ETH #Bitcoin #Ethereum #Institutional #Crypto
Trend Breakout: $ATOM Retests Reclaimed Support Floor
Analyzing the Cosmos ($ATOM) weekly chart structure, price action recently broke out above the major purple descending trendline resistance.
Following the trendline breakout, price action expanded upward (+37.50%), as projected by the blue vertical arrow, testing immediate yellow horizontal resistance boundaries. Currently, price action is undergoing a minor consolidation, retesting the newly reclaimed green horizontal support floor.
A sustained hold above this green horizontal support floor could potentially allow price action to resume its upward trajectory toward upper yellow horizontal resistance boundaries.
To maintain this breakout structure, preserving price action above the underlying green horizontal support floors remains the most critical factor.
⚠️ Not financial advice.
#ATOM #Cosmos #Crypto #Altcoins #Layer1

Macro Expansion: $RAY Retests Reclaimed Support Floor
Following up on our previous study. In our last review, we observed Raydium ($RAY) consolidating near its foundational bottom demand zone and holding lower green horizontal support floors.
Since then, price action experienced a massive expansion rally, as highlighted by the vertical black upward arrow (+324.88%), breaking through multiple horizontal levels and testing overhead yellow horizontal resistance boundaries.
After touching local peaks, price action is currently undergoing a pull-back, retesting the reclaimed immediate green horizontal support floor to form a higher base.
A sustained hold above this green horizontal support floor could potentially allow price action to regain upward momentum toward upper yellow horizontal resistance boundaries.
To maintain this macro expansion structure, preserving price action above the underlying green horizontal support floors remains the most critical factor.
⚠️ Not financial advice.
#RAY #Raydium #Crypto #DeFi #Altcoins

🔷️ $RAY has returned to the same demand zone that has repeatedly prevented deeper sell-offs over the past few months.
📉 After another rejection from the mid-range resistance, price has rotated back toward support instead of breaking the broader structure. Despite the recent weakness, buyers continue to defend this area, keeping the established trading range intact.
⚖️ The next move will likely be determined by this support. Another successful defense could trigger a fresh rotation toward the upper boundaries of the range, while a confirmed loss of demand would shift the technical structure in favor of sellers. For now, patience is more valuable than anticipation.
⚠️ Not financial advice.
#RAY #Raydium #Crypto #DeFi

BloFin Newbie Power Pack Is Here
🎁 Get up to $900 in free Futures position vouchers, plus a 20% deposit bonus of up to $500
👑 Trade $100,000 in eligible Futures volume to unlock VIP1 status for seven days, with lower fees and premium trading benefits.
⚠️ Limited to the first 100 eligible new users who register through the referral link. Campaign ends October 31. Terms and trading requirements apply.
👇 Join here:
l24.im/M586R4
Not financial advice.
#BloFin #Crypto #Futures #Bitcoin

Structural Recovery: $SOL Retests Reclaimed Support Floor
Following up on our previous study. In our last review, we observed Solana ($SOL) holding above its foundational weekly support zone.
Since then, price action experienced a strong recovery wave, as highlighted by the vertical blue upward arrow (+86.83%), breaking above immediate horizontal resistance levels. After touching higher local peaks, price action is currently undergoing a pull-back, retesting the reclaimed green horizontal support floor.
A sustained hold above this green horizontal support floor could potentially allow price action to resume momentum toward upper yellow horizontal resistance boundaries.
To maintain this structural recovery, preserving price action above the underlying green horizontal support floors remains the most critical factor.
⚠️ Not financial advice.
#Solana #SOL #Crypto #Altcoins #Layer1

📉 $SOL continues to trade just above a major weekly support zone after an extended correction. Buyers are still defending this area, but the lack of strong momentum shows that confirmation is needed before calling a trend reversal.
As long as the current support holds, a recovery toward the first resistance zone remains possible. However, losing this level on a weekly closing basis could accelerate selling pressure and open the door to lower support levels.
For now, this is one of the most important technical areas for Solana, and the upcoming weekly close will be worth watching closely.
⚠️ Not financial advice.
#Solana #SOL #Bitcoin #Crypto #Altcoins