

Population • Economy • Rankings • History • Maps • Sports • Weird Facts Making the World make sense, one number at a time 📈🌎
Global
Joined January 2026
- Tweets6.8K
- Following23
- Followers25.1K
- Likes15.1K




Data Of Statistics retweeted
Top 25 Countries With the Most Negative Views of China 🇨🇳
1. 🇯🇵 Japan — 88%
2. 🇮🇱 Israel — 73%
3. 🇺🇸 United States — 71%
4. 🇸🇪 Sweden — 71%
5. 🇰🇷 South Korea — 71%
6. 🇦🇺 Australia — 67%
7. 🇩🇪 Germany — 64%
8. 🇳🇱 Netherlands — 59%
9. 🇫🇷 France — 58%
10. 🇵🇭 Philippines — 57%
11. 🇮🇳 India — 54%
12. 🇬🇧 United Kingdom — 52%
13. 🇨🇦 Canada — 51%
14. 🇹🇷 Turkey — 50%
15. 🇮🇹 Italy — 46%
16. 🇵🇱 Poland — 41%
17. 🇭🇺 Hungary — 40%
18. 🇧🇷 Brazil — 40%
19. 🇪🇸 Spain — 39%
20. 🇿🇦 South Africa — 38%
21. 🇨🇱 Chile — 36%
22. 🇧🇩 Bangladesh — 33%
23. 🇬🇷 Greece — 32%
24. 🇦🇷 Argentina — 32%
25. 🇹🇭 Thailand — 30%
📊 Source: Pew Research Center (2026).
Data Of Statistics retweeted
Top 25 Countries With the Most Negative Views of Russia 🇷🇺
1. 🇸🇪 Sweden — 94%
2. 🇦🇺 Australia — 90%
3. 🇯🇵 Japan — 90%
4. 🇵🇱 Poland — 86%
5. 🇳🇱 Netherlands — 85%
6. 🇰🇷 South Korea — 84%
7. 🇮🇱 Israel — 84%
8. 🇺🇸 United States — 83%
9. 🇩🇪 Germany — 83%
10. 🇪🇸 Spain — 81%
11. 🇬🇧 United Kingdom — 78%
12. 🇫🇷 France — 78%
13. 🇨🇦 Canada — 76%
14. 🇮🇹 Italy — 73%
15. 🇸🇬 Singapore — 62%
16. 🇬🇷 Greece — 61%
17. 🇭🇺 Hungary — 61%
18. 🇧🇷 Brazil — 61%
19. 🇰🇪 Kenya — 59%
20. 🇨🇱 Chile — 57%
21. 🇵🇭 Philippines — 56%
22. 🇿🇦 South Africa — 52%
23. 🇦🇷 Argentina — 52%
24. 🇨🇴 Colombia — 50%
25. 🇵🇰 Pakistan — 49%
📊 Source: Pew Research Center (2026).

Data Of Statistics retweeted
Last 20 Prime Ministers of the United Kingdom 🇬🇧
1. 🇬🇧 Winston Churchill (1940–1945)
2. 🇬🇧 Clement Attlee (1945–1951)
3. 🇬🇧 Winston Churchill (1951–1955)
4. 🇬🇧 Anthony Eden (1955–1957)
5. 🇬🇧 Harold Macmillan (1957–1963)
6. 🇬🇧 Alec Douglas-Home (1963–1964)
7. 🇬🇧 Harold Wilson (1964–1970)
8. 🇬🇧 Edward Heath (1970–1974)
9. 🇬🇧 Harold Wilson (1974–1976)
10. 🇬🇧 James Callaghan (1976–1979)
11. 🇬🇧 Margaret Thatcher (1979–1990)
12. 🇬🇧 John Major (1990–1997)
13. 🇬🇧 Tony Blair (1997–2007)
14. 🇬🇧 Gordon Brown (2007–2010)
15. 🇬🇧 David Cameron (2010–2016)
16. 🇬🇧 Theresa May (2016–2019)
17. 🇬🇧 Boris Johnson (2019–2022)
18. 🇬🇧 Liz Truss (2022)
19. 🇬🇧 Rishi Sunak (2022–2024)
20. 🇬🇧 Keir Starmer (2024–Present)
📊 Source: Wikipedia.
Data Of Statistics retweeted
Top 10 Footballers to Miss Most Penalties Since 2001 ⚽
1. 🇵🇹 Cristiano Ronaldo - 37
2. 🇦🇷 Lionel Messi - 35
3. 🇧🇷 Neymar - 22
4. 🇮🇹 Ciro Immobile - 19
5. 🇮🇹 Francesco Totti - 18
6. 🇸🇪 Zlatan Ibrahimovic - 17
7. 🇧🇷 Ronaldinho - 16
8. 🇫🇷 Kylian Mbappe - 16
9. 🇺🇾 Edinson Cavani - 16
10. 🏴 Harry Kane - 15
📊 Sources: GiveMeSport.
Data Of Statistics retweeted
Top 25 Countries That Drink the Most Beer (Liters Per Person) 🍺
1. 🇨🇿 Czechia — 148.8 L
2. 🇱🇹 Lithuania — 110.6 L
3. 🇦🇹 Austria — 104.6 L
4. 🇮🇪 Ireland — 99.0 L
5. 🇭🇷 Croatia — 95.1 L
6. 🇪🇪 Estonia — 93.2 L
7. 🇪🇸 Spain — 91.8 L
8. 🇸🇮 Slovenia — 88.4 L
9. 🇷🇴 Romania — 87.4 L
10. 🇩🇪 Germany — 86.9 L
11. 🇵🇦 Panama — 86.1 L
12. 🇲🇽 Mexico — 83.4 L
13. 🇵🇱 Poland — 83.2 L
14. 🇧🇬 Bulgaria — 81.4 L
15. 🇸🇰 Slovakia — 81.0 L
16. 🇬🇦 Gabon — 80.9 L
17. 🇱🇻 Latvia — 79.1 L
18. 🇿🇦 South Africa — 75.2 L
19. 🇭🇺 Hungary — 74.1 L
20. 🇧🇦 Bosnia and Herzegovina — 71.4 L
21. 🇧🇷 Brazil — 70.3 L
22. 🇫🇮 Finland — 68.7 L
23. 🇵🇹 Portugal — 66.9 L
24. 🇬🇧 United Kingdom — 66.3 L
25. 🇳🇱 Netherlands — 66.2 L
📊 Source: Kirin Holdings (2024).
Data Of Statistics retweeted
Every US State Ranked by Alcohol Consumption 🍺
1. 🇺🇸 New Hampshire — 4.19 gallons
2. 🇺🇸 Delaware — 3.85 gallons
3. 🇺🇸 Washington D.C. — 3.54 gallons
4. 🇺🇸 Nevada — 3.40 gallons
5. 🇺🇸 North Dakota — 3.38 gallons
6. 🇺🇸 Wisconsin — 3.07 gallons
7. 🇺🇸 Montana — 3.05 gallons
8. 🇺🇸 California — 2.99 gallons
9. 🇺🇸 Colorado — 2.96 gallons
10. 🇺🇸 Vermont — 2.85 gallons
11. 🇺🇸 Florida — 2.82 gallons
12. 🇺🇸 Minnesota — 2.80 gallons
13. 🇺🇸 Missouri — 2.77 gallons
14. 🇺🇸 Massachusetts — 2.75 gallons
15. 🇺🇸 Rhode Island — 2.75 gallons
16. 🇺🇸 Wyoming — 2.72 gallons
17. 🇺🇸 Maine — 2.69 gallons
18. 🇺🇸 Alaska — 2.68 gallons
19. 🇺🇸 Louisiana — 2.64 gallons
20. 🇺🇸 Oregon — 2.58 gallons
21. 🇺🇸 Hawaii — 2.53 gallons
22. 🇺🇸 New Jersey — 2.52 gallons
23. 🇺🇸 Pennsylvania — 2.42 gallons
24. 🇺🇸 Indiana — 2.36 gallons
25. 🇺🇸 Illinois — 2.33 gallons
26. 🇺🇸 Iowa — 2.27 gallons
27. 🇺🇸 Tennessee — 2.27 gallons
28. 🇺🇸 Connecticut — 2.25 gallons
29. 🇺🇸 Texas — 2.25 gallons
30. 🇺🇸 Michigan — 2.22 gallons
31. 🇺🇸 Arizona — 2.21 gallons
32. 🇺🇸 North Carolina — 2.21 gallons
33. 🇺🇸 New Mexico — 2.20 gallons
34. 🇺🇸 New York — 2.19 gallons
35. 🇺🇸 Kansas — 2.14 gallons
36. 🇺🇸 Kentucky — 2.12 gallons
37. 🇺🇸 Maryland — 2.12 gallons
38. 🇺🇸 Mississippi — 2.07 gallons
39. 🇺🇸 Virginia — 2.07 gallons
40. 🇺🇸 Washington — 2.05 gallons
41. 🇺🇸 South Dakota — 2.04 gallons
42. 🇺🇸 Ohio — 1.96 gallons
43. 🇺🇸 Georgia — 1.92 gallons
44. 🇺🇸 Nebraska — 1.92 gallons
45. 🇺🇸 South Carolina — 1.92 gallons
46. 🇺🇸 Alabama — 1.87 gallons
47. 🇺🇸 Arkansas — 1.82 gallons
48. 🇺🇸 Idaho — 1.71 gallons
49. 🇺🇸 Oklahoma — 1.70 gallons
50. 🇺🇸 West Virginia — 1.64 gallons
51. 🇺🇸 Utah — 1.14 gallons
📊 Source: NIAAA (2024).
Data Of Statistics retweeted
Total Military Aircrafts by Country (2025) 🪖
1. USA 🇺🇸 - 13,043
2. Russia 🇷🇺- 4,292
3. China 🇨🇳- 3,309
4. India 🇮🇳 - 2,229
5. South Korea 🇰🇷 - 1,592
6. Japan 🇯🇵 - 1,443
7. Pakistan 🇵🇰 - 1,399
8. Egypt 🇪🇬- 1,093
9. Turkey 🇹🇷 - 1,083
10. France 🇫🇷 - 976
11. Saudi Arabia 🇸🇦 - 917
12. North Korea 🇰🇵- 861
13. Taiwan 🇹🇼 - 761
14. Italy 🇮🇹 - 727
15. UK 🇬🇧 - 631
16. Israel 🇮🇱 - 611
📊 Source: Global Fire Power.
Data Of Statistics retweeted
Top 25 Countries With the Most Expensive Mobile Data 📱
1. 🇿🇼 Zimbabwe — $43.75
2. 🇫🇰 Falkland Islands — $40.58
3. 🇸🇭 Saint Helena — $40.13
4. 🇸🇸 South Sudan — $23.70
5. 🇹🇰 Tokelau — $17.24
6. 🇾🇪 Yemen — $15.68
7. 🇹🇲 Turkmenistan — $11.42
8. 🇨🇫 Central African Republic — $10.90
9. 🇰🇾 Cayman Islands — $8.39
10. 🇿🇲 Zambia — $8.01
11. 🇨🇭 Switzerland — $7.29
12. 🇫🇲 Micronesia — $7.11
13. 🇸🇧 Solomon Islands — $6.96
14. 🇳🇫 Norfolk Island — $6.39
15. 🇦🇽 Åland Islands — $6.12
16. 🇲🇭 Marshall Islands — $6.08
17. 🇹🇻 Tuvalu — $6.08
18. 🇺🇸 United States — $6.00
19. 🇳🇿 New Zealand — $5.89
20. 🇸🇨 Seychelles — $5.43
21. 🇨🇦 Canada — $5.37
22. 🇻🇬 British Virgin Islands — $5.24
23. 🇰🇷 South Korea — $5.01
24. 🇧🇸 Bahamas — $4.99
25. 🇦🇩 Andorra — $4.82
📊 Source: Cable.co.uk (2023).
Data Of Statistics retweeted
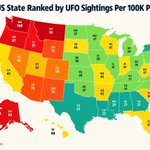
Every US State Ranked by UFO Sightings Per 100K People 🛸
1. 🇺🇸 Washington — 100
2. 🇺🇸 Montana — 95
3. 🇺🇸 Alaska — 90
4. 🇺🇸 Vermont — 90
5. 🇺🇸 Oregon — 87
6. 🇺🇸 Maine — 85
7. 🇺🇸 New Hampshire — 85
8. 🇺🇸 Idaho — 81
9. 🇺🇸 New Mexico — 79
10. 🇺🇸 Arizona — 76
11. 🇺🇸 Wyoming — 72
12. 🇺🇸 Nevada — 62
13. 🇺🇸 Colorado — 60
14. 🇺🇸 Connecticut — 54
15. 🇺🇸 Rhode Island — 53
16. 🇺🇸 Utah — 52
17. 🇺🇸 Hawaii — 48
18. 🇺🇸 West Virginia — 47
19. 🇺🇸 South Carolina — 46
20. 🇺🇸 Missouri — 45
21. 🇺🇸 South Dakota — 44
22. 🇺🇸 Delaware — 43
23. 🇺🇸 Arkansas — 42
24. 🇺🇸 California — 41
25. 🇺🇸 Wisconsin — 41
26. 🇺🇸 Florida — 41
27. 🇺🇸 Indiana — 40
28. 🇺🇸 Kansas — 39
29. 🇺🇸 Iowa — 38
30. 🇺🇸 Minnesota — 37
31. 🇺🇸 North Dakota — 37
32. 🇺🇸 Massachusetts — 37
33. 🇺🇸 Oklahoma — 37
34. 🇺🇸 Kentucky — 37
35. 🇺🇸 Pennsylvania — 37
36. 🇺🇸 North Carolina — 37
37. 🇺🇸 Ohio — 36
38. 🇺🇸 Nebraska — 36
39. 🇺🇸 Michigan — 34
40. 🇺🇸 Tennessee — 34
41. 🇺🇸 Illinois — 32
42. 🇺🇸 Virginia — 32
43. 🇺🇸 New Jersey — 30
44. 🇺🇸 Maryland — 29
45. 🇺🇸 New York — 28
46. 🇺🇸 Alabama — 27
47. 🇺🇸 Georgia — 27
48. 🇺🇸 Mississippi — 25
49. 🇺🇸 Louisiana — 23
50. 🇺🇸 Texas — 23
51. 🇺🇸 Washington D.C. — 22
📊 Source: Stacker / NUFORC (2023).