

Tech Talk is a free stock market letter service available at https://xitter.cf/t.co/BJV0N7vrq2 and https://xitter.cf/t.co/qBCl3egWXc. Ask us about the Seasonal Advantage Portfolio.
America
Joined December 2009
- Tweets14.3K
- Following424
- Followers10.1K
- Likes405







Pinned Tweet
Out now…
Our monthly report for October is available for download, providing insights, analysis, and trade ideas to navigate the market through the month(s)/year ahead.
Subscribe now to receive this 106-page report: charts.equityclock.com/subsc…
#Stocks #Bonds #Commodities #Gold


US New Home Sales are eerily unchanged through the first three quarters of the year, highlighting weakness in the housing market that is akin to periods of economic recession. The median price of new homes sold is showing the second largest drawdown three-quarters of the way through the year in the past three decades. Housing is certainly sending a warning sign pertaining to the health of the economy. $STUDY $MACRO $ITB #Economy #Housing


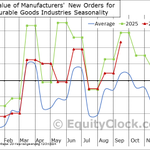
US Durable Goods Orders continue to run strong heading into the end of the year, conducive to strength in pro-cyclical segments of the market through November and December. Orders of Durable Goods jumped by 9.2% (NSA) in September, well ahead of the 5.3% increase that is average for this end of quarter month. $STUDY $MACRO $XLI $XLB

This period surrounding the Mid-Term Election is typically strongly positive for stocks. equityclock.com/2026/10/26/s… $SPX $SPY $ES_F

Nice bounce in Technology $XLK today as near-term downside momentum starts to fade. We have our eye on the October 22nd downside gap: failure from here keeps the status quo of lower-lows and lower-highs, while a breakout would start to suggest that the bulls are back in charge. The same applies to the short-term chart of the S&P 500 $SPY

Communication Services ETF $XLC breaking below horizontal support at $105, proposing a theoretical downside move to $92. We have been suggesting to our subscribers that they Avoid (Sell/Short) exposure for months

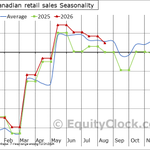
Despite the ongoing influence on retail sales from the high cost of fuel (gasoline), consumer activity in Canada is on the decline heading through the back half of the year. Retail sales in Canada fell by 1.7% (NSA) in August, much weaker than the 0.3% decline that is normal for this summer month. The year-to-date change has dipped below the seasonal norm with an increasing number of categories showing below average trajectories heading towards the important shopping period at year-end. $STUDY $MACRO #CDNecon #CAD

Two phantom weights remain heavy on the market: Concerns about AI debt and the mid-term election outcome. We’ll show you what we are doing (or have done) about it. equityclock.com/2026/10/22/s… $SPY $QQQ $DIA

Not liking the head-and-shoulders setup on the hourly chart of the S&P 500 Index. Horizontal support at 7620 is key. We told subscribers following our Super Simple Seasonal Portfolio to dump the large-cap benchmark on Tuesday, favouring income generating exposure that is holding up quite nicely today. $SPX $SPY

Consumers look set to rely heavily on credit this holiday shopping season, providing a tailwind to consumer finance stocks. equityclock.com/2026/10/21/s… $V $MA $AXP

What would you do with a chart like this? Upside gaps followed by downside gaps. Obviously, play the range between 375 and 385 (buy the lows, sell the highs) and look for the cues as to the longer-term move by the direction of the resolution. Been a mess recently. $GLD

Traders leaning into defensive sectors as credit spreads balloon and as strength in high-beta segments fades. equityclock.com/2026/10/20/s… $XLV $XLRE $XLU

Scott Wapner @TheJudgeCNBC @CNBC: “Good luck finding the case there is a demand problem” pertaining to the AI buildout.
Certainly nothing definitive, or sustainable, yet, Information Processing Business Equipment Production, which has tracked the strength of the AI buildout pretty well since the spring of 2025, recorded a pronounced dip in September. Could be mid-term election hesitation or just mere end of quarter fluctuation as supply chain impacts cool the pace of expansion, but a datapoint has been provided to cue in on pertaining to the strength of demand. $SMH $XLK

One thing in the Industrial Production report that stood out was the abrupt September decline in Information Processing Business Equipment production. The category has been tracking the AI infrastructure buildout among businesses and this pullback, while just one month, certainly provides a tangible datapoint that backs the concerns the market is expressing pertaining to the AI trade. An above average trend persist three quarters of the way through the year, but the heat has definitely faded from what was observed earlier in the year. $XLK $SMH $DRAM


Canadian consumer inflationary pressures continue to run hot, fuelled by the high price of gas, various tariff pressures (eg. refrigerators), and the demand for AI infrastructure. CPI in Canada is up by 3.0% three-quarters into this year, firmly ahead of the 2.4% rise that is average for this timeframe. $STUDY $MACRO #CDNecon #CAD

The high cost of borrowing continues to cripple the housing market, creating the weakest year-to-date change in housing starts since 2007 (the period leading into the Great Financial Crisis). US Housing starts are higher by a mere 4.4% through the first three quarters of 2026, significantly weaker than the 29.3% rise that is average for this timeframe. $STUDY $MACRO $ITB #Economy #Housing

Daily Market Update:
Traders bought into the tech weakness on Monday, lifting the growth sector and benchmarks heavy in this influence off of the floor from last week’s selloff. The S&P 500 Index recovered four-tenths of one percent, bouncing from the lower limit of the trading range that the benchmark has been in since August between 7620 and 7800. On Friday, the index broke below short-term rising trend channel support that had promoted the recent path of higher-highs and higher-lows in the past month. The benchmark is struggling around 20 and 50-day moving averages and the 100-day moving average remains a critical line in the sand. Weakening support raises concerns for the health of stocks moving forward. The market has reached the time of year when volatility starts to peak and roll over through the last couple of months of the year, thereby promoting strength in stocks, but the breakout in the VIX on Friday above declining trendline resistance provides the inkling that the instability that is leaching into the market may just be getting started.
$SPX $SPY
For trade ideas and ways to allocate your portfolio, subscribe to receive our daily reports: charts.equityclock.com/subsc…

