

Where technicals and fundamentals converge. Screen trends, rank industries, analyze earnings calls, research the business, track alternative data
Joined December 2025
- Tweets351
- Following158
- Followers1.6K
- Likes1.5K







Pinned Tweet
EquityDesk.ai is live:
- Stage Analysis for US, Europe and Asia
- Deep Research and Slide decks with standardized prompt for 3000+ global companies
- Earnings Call Ratings
- Industry Group Leaders/Laggards
- Alternative Data (Google Trends, TikTok, Reddit and Wikipedia) weekly
equitydesk.ai retweeted

This is what the Technogym slide deck should really be called. Stay tuned! 🫡 $TGYM


US Equity Rotation, Week Ending November 13, 2026
What happened
The S&P 500 rose 2.5% and the Nasdaq 2.3%, ending a four-week losing streak. The median US stock gained 1.4% and 64% of stocks closed higher. All of it came on Monday; the rest of the week took stage breadth back down.
The session sequence (median price change, share of stocks up): Monday +2.3% (83%), Tuesday and Wednesday combined +0.1% (52%), Thursday and Friday combined -1.1% (29%). On relative strength: Monday +0.05 (50% beat the market), Tuesday and Wednesday -0.73 (38%), Thursday and Friday -0.33 (45%).
Mean ED score fell from 4.31 to 4.01. Median Mansfield RS slipped from -3.3 to -3.9.
Stage 2 vs Stage 4 stock count: 1.06, down from 1.21. 46.7% of US stocks are in Stage 2 (43.5% last week, 49.2% at Monday's close). Stage 4 rose from 35.9% to 44.2%. Net stage breadth closed at +2.5, after +7.6 last Friday and +17.5 on Monday. The 475 stocks that sat in transitional stages after the November 5 drop resolved this week: 75 went to Stage 2 on Monday, and most of the rest went to Stage 4 on Thursday and Friday, when 242 stocks entered Stage 4 against 33 entering Stage 2.
Fresh Stage 2 vs fresh Stage 4: 138 vs 349, the widest negative gap since the week of September 25 (94 vs 330). Prior weeks: 174 vs 194, 156 vs 148, 166 vs 158. Toppings (former leaders breaking into Stage 4): 10, after 58 the week before. RVMD broke after 60 weeks in Stage 2, IFF after 33, APPS after 24.
Macro: October CPI +0.4% month on month with core +0.3% for a third straight month; October PPI +6.5% year on year, the fastest since November 2022. The 10-year yield rose about 30 bp on the week to 5.15%. A December hike is roughly 90% priced. WTI crude settled at $88.56. Nvidia announced on November 12 that Jensen Huang had resigned as CEO, with CFO Colette Kress named interim CEO.
What it means
The fault line ran between the groups that bounce when the Nasdaq bounces and the groups that are priced off the 10-year.
The chip bounce reversed in stage terms. Semiconductors gained a median 7.0% for the week, yet the group ended with 11 Stage 2 vs 55 Stage 4 after 34 fresh Stage 4 entries, on average 23% below the 30-week average with 15% of names above it. Applied Materials, Lam and KLA each went from Stage 3 back to Stage 4 on Thursday and Friday. $NVDA -12.7% for the week, 23% below its 30-week average, the low of this decline. $AMD +18.9% to Stage 2 and AVGO +18.2% to Stage 3 are the exceptions. Construction and engineering: 5 Stage 2 vs 20 Stage 4 after a +6.0% week. Communications equipment: 3 vs 13. The build-out chain as a whole: 27 Stage 2 vs 87 Stage 4, 16% below its averages.
The rate-sensitive side sold off as yields rose 30 bp. Household durables -4.2% (15% beat the market), autos -4.6% (8%), consumer finance -3.7% (4%), mortgage REITs -4.2% (9%), airlines flat after +9% a week earlier (18%). Banks had 12% of names beat the market. $GOOGL -12.6% on Thursday, now 15% below its 30-week average in Stage 4.
Energy, the group that broke two weeks ago, rebounded: oil and gas +6.0% with 73% beating the market and Stage 2 count back from 26 to 43; energy equipment +5.7% but still 2 Stage 2 vs 27 Stage 4.
Quality moved the wrong way. Stage 2 names with a combined rating of 85 or higher: 83 three weeks ago, 66 last Friday, 36 now. The 17 new high-rated Stage 2 entries this week have no group behind them (GEO 90, CLF 89, ZIP 87, PANL 87, UNFI 87, FITB 87, USB 87, NET 86, ANET 86, MPWR 85, UNH 85). For the sixth week in a row, last week's strongest stocks underperformed last week's weakest on relative strength (-2.2 vs -0.5).
Where the leadership is
No group combines rising breadth, a Stage 2 majority and rising quality this week.
Marine transportation: 7 Stage 2 vs 2 Stage 4, median Mansfield RS +6.7, ED score 4.9, 70% beat the market. PANL +22.6% (ED 8, rated 87), SB +16.6% (ED 8, rated 86), GSL +10.3%, ZIM +5.0%. The only cyclical group with a Stage 2 majority and positive relative strength.
Oil and gas: 43 Stage 2 vs 42 Stage 4, 73% beat the market, but the group is one week off a 33-name breakdown. GRNT +19.1% (ED 9), HPK +15.1%, MPC +11.2%, ASC +12.1% (fresh Stage 2 rated 86).
Life sciences tools: 27 Stage 2 vs 4 Stage 4, ED score 6.5, median Mansfield RS +18.6, yet only 23% beat the market this week and the group is 16% above its averages. AZTA +16.6% (ED 8) and WST +4.2% (ED 8) led; ICLR -4.9%, TEM -5.9%, FTRE -8.0% lagged.
Software: 82 Stage 2 vs 45 Stage 4, median Mansfield RS +5.4, 37% beat the market. Holding its structure without leading. ZETA +18.1% (ED 9), FROG +12.5% (ED 9), ZM +11.0% (ED 8) against QLYS -9.2%, ASAN -8.5%, APPS -26.7% (fresh Stage 4 after 24 weeks).
Where the weakness is
Every weak group this week is priced off the 10-year or off consumer credit, and each led the October repair.
Household durables: 11 Stage 2 vs 13 Stage 4, RS change -6.4, 15% beat the market. DFH -14.0%, ETD -12.8%, LGIH -9.4%, NVR -7.1%, CCS -7.0%. Builders broke as the 10-year rose 30 bp; SONO +9.5% (ED 9) and NWL +5.7% (ED 8) held.
Automobiles: 6 Stage 2 vs 6 Stage 4, RS change -5.6, 8% beat the market. RIVN -10.5%, THO -4.6%, F -4.3%, NIO -14.5%. TSLA +8.9% was the one name to beat the market by a margin.
Consumer finance: 5 Stage 2 vs 15 Stage 4, RS change -4.0, median Mansfield RS -16.8, 4% beat the market. NAVI -26.0%, UPST -10.6%, PRAA -8.4%, GDOT -5.6%.
Mortgage REITs: 1 Stage 2 vs 18 Stage 4, median Mansfield RS -30.7, 9% beat the market, 26% below the 30-week average. AGNC -6.3%, STWD -5.9%, DX -5.7%, ABR -20.5%.
Broadline retail: 9 Stage 2 vs 6 Stage 4, RS change -5.0, 35% beat the market. GRPN -19.9%, BABA -13.8%, CPNG -6.8%. M +7.0% (ED 8) and SVV +6.3% held.
Banks: 67 Stage 2 vs 45 Stage 4, but 12% beat the market. HWC -8.7% (fresh Stage 4), HOPE -1.2%, CVBF -1.0%; the money center names JPM +3.5%, C +4.2%, BAC +3.2% did better than the regionals.
The stocks still in Stage 2 are not fragile: median 10.3% above the 30-week average, 17% within 3%. The problem is direction, not distance.
How to position
Net stage breadth is positive by 2.5 points, which keeps the October turn alive on the letter of the rule and nothing more. The Stage 2 share (46.7%) is 9 points above its level four weeks ago, so the four-week trend still reads as improving, but the last three sessions produced the heaviest fresh Stage 4 count since late September.
Exposure stays with groups that hold a Stage 2 majority and did not break this week: software, life sciences tools, health care equipment, marine, select staples and insurance. Sizing in tranches continues; a market that flips 10 points of net breadth in three sessions is not one to be fully invested in on a Monday.
Semiconductors and the build-out chain are back in Stage 4 by count after a one-week bounce. Rate-sensitive consumer groups (home builders, autos, consumer finance) lost their Stage 2 status in the same week yields moved 30 bp, and would need yields to stop rising before they can lead again.
What to watch: net stage breadth at the November 20 close (above zero keeps the recovery alive; a negative print would mean the October turn failed), the 10-year above 5.15% and the December hike pricing, Nvidia's results and the CEO transition, and whether the 242 Thursday and Friday Stage 4 entries extend into Monday.


5
720
Our Institutional tier idea from 7th of October $4860.T


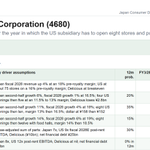
Round One $4680.T Japan comp +26.5% (profit +52%), operating leverage in action. US comp somewhere around 8% (my calculation), profit depressed as they expand. Guidance raised, second-half assumptions untouched. Store plan implies 5 US openings in the next 5 months. Stock +11%. LFG! 🚀


4
397
Where this leaves the four-week recovery. On Oct 16 it was 37.5% uptrends vs 52.6% downtrends. Today 46.7% vs 44.2%. The median uptrend is still 10.3% above its line and only 17% are within 3%, so the surviving uptrends are not flimsy. But the direction of travel this week was wrong on every count that matters: fresh downtrends 2.5 to 1, net breadth down 15 points from Monday, quality count halved, chips back in Stage 4. On Wednesday I said the risk was that the bounce “succeeds narrowly and drains the rest”; it didn’t even succeed narrowly. The test for next week is simple: net breadth at Friday’s close above zero keeps the recovery alive; a negative print would mean the October turn failed, and the Sep 25 to Oct 16 pattern (stage counts sliding 1 to 2 points a day) would be the template again.
3
352
equitydesk.ai retweeted
Finally completed a write-up on my biggest position, Round One $4680.T, just in time for the earnings release 😅 I like it for the same reason as $PTON: it’s cheap, it fits multiple trends and it has a clear catalyst to unlock the value. Japan alone is worth the share price; the US business, 60 stores and an IPO filed, comes for roughly nothing. Not a joke, not an overstatment. Do the math yourself 🫡


What if I told you there is a US business the market values at zero because it sits inside a Japanese company (parents will know the concept), that the gap closes within months, and that this business is:
- effectively the Japanese IP distributor in America, with One Piece card packs, Persona, Bleach, Godzilla, Sanrio and Demon Slayer drops you can only get at its 60 venues, and a moat its competitors just admitted they need (“IP fandoms”, Dave & Buster’s, September)
- the main source of mall traffic now that apparel visits are down 25% since 2019, with landlords funding part of its fit-outs to get it into their empty anchor boxes
- taking share from $PLAY and $LUCK: its per-store sales +6.5% in dollars while Dave & Buster’s comps have been negative for two years running and Lucky Strike is flat
- growing revenue about 15% a year for the next three years, with 17 stores in the pipeline on top of 60, four opening between Oct 10 and November and three more dated for 2027, most of them twice the size of the old ones
- going to IPO in the US: since May the parent refuses to discuss US plans “due to US securities law considerations”
Why free: the parent, Round One $4680.T, trades at ¥1,297.5. Japan alone, 99 stores with sales +26% last quarter, is worth ¥1,325 a share at 8x EBITDA. The US, ¥16bn of EBITDA going to ¥24bn, is in the price for zero.
(last image is my kids in a similar concept yesterday)


US Equity Rotation, Week Ending November 6, 2026
What happened
The S&P 500 fell 2.7% and the Nasdaq 3.4%, the worst week since June, while the median US stock was flat (-0.2%) and 48% of stocks closed higher. The index damage was concentrated in semiconductors and energy; the rest of the market absorbed it.
The session sequence for relative strength (median daily change, share of stocks beating the market): Monday +1.39 (66%), Tuesday -0.65 (36%), Wednesday +0.65 (58%), Thursday +1.05 (61%), Friday -0.40 (42%). Thursday is the one to note: the median stock lost 3.2% and only 13% rose, yet 61% beat the market, because the Nasdaq fell about 5.5% and the semiconductor index about 12%. Friday reversed that: chips bounced, the rest of the market gave back.
Mean ED score rose from 4.07 to 4.31. Median Mansfield RS improved from -5.2 to -3.3.
Stage 2 vs Stage 4 stock count: 1.21, up from 0.97 and 0.83. 43.5% of US stocks are in Stage 2 (44.8% last week), 35.9% in Stage 4 (46.3%). Net stage breadth closed at +7.6, the first positive weekly close since early September. The Stage 2 share fell; the improvement came from Stage 4 shrinking as stocks moved into transitional stages, which went from 201 to 475 in one week.
Fresh Stage 2 vs fresh Stage 4: 174 vs 194. Prior weeks: 156 vs 148, 166 vs 158, 141 vs 223, 102 vs 188. Toppings (former leaders breaking into Stage 4): 58, after 25, 9 and 30. 33 of the 58 were oil and gas. Long trends ended: PBYI after 64 weeks in Stage 2, UFCS 63, STLD 58, $TRGP 48, KNTK 40.
Friday: 54 fresh Stage 2 vs 102 fresh Stage 4.
Macro: October payrolls +165k vs about 60k expected, unemployment 4.1%, and the market priced roughly a 78% chance of a December hike. The 10-year yield closed at 4.86%. WTI crude fell to about $90 from $103 a week earlier, Brent below $100. VIX 25.6 after Thursday's spike. Thursday's selling was attributed to post-midterm concern about tighter AI and data center rules.
What it means
The fault line this week ran between the two groups that led the market from summer through October, energy and the AI capex chain, and everything domestic.
Energy went from 64% of names in Stage 2 to 21% in one week. Oil and gas: median -12.6%, 3% of names beat the market, 26 Stage 2 vs 49 Stage 4 (67 vs 24 a week earlier). Energy equipment: -13.9%, 1 Stage 2 vs 15 Stage 4. CVI -34.7%, HPK -29.9%, SM -25.9%, PTEN -25.5%, VAL -24.3%.
The AI chain had its worst week and its best day inside five sessions. Semiconductors -8.2% for the week, 5 Stage 2 vs 27 Stage 4, median Mansfield RS -19.6, group on average 27% below the 30-week average. $MU -22.0%, MRVL -28.1%, MXL -27.1%, ALAB -26.3%, NVDA -8.8% (Stage 3, 12% below its average).
Communications equipment -13.0%, electronic components -8.4%, hardware -7.4%, construction and engineering -7.1%, electrical equipment -7.9%. Friday's bounce (semis +6.7% with 93% of names up) moved most chip names from Stage 4 to Stage 3 rather than to Stage 2; 39 of 71 semis are now in a transitional stage.
The money went to airlines, restaurants, media, retail, REITs and staples. Consumer discretionary +2.6% for the week with 76% beating the market, communication services +2.2%, real estate +1.9%, staples +1.7%.
+7.9%, back in Stage 2 with a combined rating of 95. For the fifth week in a row, last week's weakest stocks beat last week's strongest (-0.3% vs -3.5%).
Quality moved with the rotation. Stage 2 names rated 85 or higher fell from 83 to 66 as energy and industrial names dropped out, while 28 new high-rated Stage 2 entries started, led by health care (AGL 93, PRVA 90, NBIX 89, TMDX 88, IDXX 87), retail (AMZN 95, SVV 90), REITs (AMH 89, BRX 88, CURB 88, VNO 87) and machinery (CMCO 86, ITT 85, MIDD 85). Health care holds 23 of the 66; technology holds none.
Where the leadership is
Airlines: RS change +11.4, median Mansfield RS +1.9, 6 Stage 2 vs 4 Stage 4, 91% beat the market, median +9.0%.
Media and entertainment: ED score 5.2, RS change +7.4, 28 Stage 2 vs 15 Stage 4, 83% beat the market.
Household durables: ED score 5.0, RS change +7.3, 96% beat the market.
Restaurants and leisure: RS change +6.3, 43 Stage 2 vs 19 Stage 4 (16 vs 56 three weeks ago), 81% beat the market.
REITs (retail, office, residential, health care): RS change +5.5, 96% beat the market, though still 23 Stage 2 vs 26 Stage 4.
Beverages, household products and food: RS change +5.1, 32 Stage 2 vs 20 Stage 4, 82% beat the market.
Software is split rather than leading: 86 Stage 2 vs 32 Stage 4, median -3.9% for the week, 46% beat the market. U +36.6%, PCOR +22.7% against DDOG -23.9%, TEAM -19.8%, FIVN -22.6%.
How to position
Net breadth is positive for the first time in two months and the Stage 2 share (43.5%) is 6 points above its level four weeks ago. That argues for staying invested, with exposure concentrated where breadth and quality agree: restaurants and leisure, media, airlines, broadline retail, select REITs and staples, health care services and equipment.
The fresh Stage 2 entries sit a median 3.4% above their 30-week averages and 45% are within 3%, so sizing stays in tranches. Established Stage 2 names are a median 9.9% above.
Energy and the AI capex chain are Stage 4 or Stage 3 groups 20 to 27% below their averages. Friday's chip rally is a bounce inside a downtrend until those averages are retaken; a group this far below its line needs weeks of base-building, not one session.
What to watch: October CPI on Tuesday and PPI on Friday with a December hike priced at 78%; whether oil holds below $90 and extends the energy breakdown; whether Friday's rotation back into chips repeats and drains the consumer and REIT groups; and whether the Stage 2 share holds above 40% with net breadth positive at next Friday's close.
Leaders and laggards in replies.


3
4
1,035
We closed our $CRCT position on Friday with a 50% gain 🫡

Our Institutional tier is here. Subscribers will get access to research on our best-picks portfolio. Here are a few companies from our recent coverage:
Birkenstock Holding plc $BIRK : A 250-year-old fad
Cricut, Inc. $CRCT : Recovering from Covid
Bachem Holding AG $BANB : Customer funded growth
Planoptik AG $P4O : Glass castle: deep moat, many pillars


The market is healing underneath while the index looks sick. That’s usually the better order.
Net stage breadth (stocks in uptrends minus stocks in downtrends, US-listed only): −15.1% on Oct 16, −1.6% on Oct 30. Two weeks of +6.8 and +6.7 points, the biggest back-to-back gains since April.
44.8% of stocks are now in Stage 2 uptrends, up from 37.5%. Fresh uptrends have outnumbered fresh downtrends two weeks in a row after five weeks the other way. 52-week highs minus lows turned positive for the first time since early September.


US Equity Rotation, Week Ending October 30, 2026
What happened
The index and the average stock went opposite ways. The S&P 500 fell 0.6% and the Nasdaq 2.0% for the week, while the Russell 2000 rose 1.3%. The median US stock gained 0.8% and 58% of stocks closed higher.
The session sequence for relative strength (median daily change, share of stocks beating the market): Monday -2.08 (31%), Tuesday -0.18 (45%), Wednesday -0.18 (45%), Thursday +1.29 (74%), Friday +0.71 (62%). Friday is the odd one: the median stock fell 1.0% and only 31% rose, yet 62% beat the market, because the megacaps fell harder than everything else.
Mean ED score rose from 3.82 to 4.08. Median Mansfield RS improved from -6.9 to -5.2.
Stage 2 vs Stage 4 stock count: 0.97, up from 0.83 and 0.71 the two weeks before. 44.8% of US stocks are in Stage 2, up from 41.8%. Stage 4 fell from 50.0% to 46.3%. Net stage breadth is -1.6, the best reading since September 18.
Fresh Stage 2 vs fresh Stage 4: 156 vs 148. Prior weeks: 166 vs 158, 141 vs 223, 102 vs 188, 86 vs 211. Toppings (former leaders breaking into Stage 4): 25, after 9 the week before and 30 two weeks ago. BUSE broke after 51 weeks in Stage 2, CLH after 47, QUAD after 46, EBF after 42.
Friday was heavy underneath: 109 fresh Stage 4 vs 52 fresh Stage 2, so the week's breadth gain was banked on Thursday.
Macro: the Fed held at 3.75% to 4.00% with two dissents in favor of a hike, Q3 GDP came in at 3.4% annualized, core PCE at 3.1% year over year, the 10-year yield closed near 4.93% and WTI crude near $103. Alphabet and Amazon both reported negative free cash flow on AI capex and sold off.
What it means
The fault line this week ran between large-cap tech and the cyclical middle of the market.
Software: median -3.0%, only 34% of names beat the market, Stage 2 count down from 98 to 95. $NOW fell 33.9% on results and went from Stage 2 to Stage 4 in a week. FTNT -24.4%, TEAM -15.8%, DDOG -12.7%, CRM -7.8%. Internet: median -4.4%, 10 Stage 2 vs 17 Stage 4.
-12.6%, now 20% below its 30-week average, RDDT -36.4%, SNAP -15.8%. Tech hardware -3.4%.
Semiconductors: 10 Stage 2 vs 54 Stage 4, NVDA back in Stage 4 at 3.5% below its average, INTC -24.4%, MRVL -14.1%. Chip equipment bounced for the week (KLAC +8.4%, LRCX +3.9%) and then dropped 6 to 7.5% on Friday alone.
The buying went to consumer and industrial cyclicals. Consumer discretionary was the best sector: median +2.6%, 72% beat the market, Stage 2 share up from 28% to 40% in one week. Restaurants and leisure had 17 fresh Stage 2 entries, taking the group from 16 to 33 in Stage 2. Cruise lines moved together: RCL +11.1%, CCL +10.4%, NCLH +16.4%. Autos:
+15.1% and TSLA +7.4%, both fresh Stage 2 with ratings of 84 and 81. Equipment rental and distribution: HRI +29.4%, CTOS +17.0%, ALTG +18.6%, URI +6.5%. Aerospace and defense +4.6% with 86% beating the market, led by HII +15.6%. Utilities had 94% of names beat the market and the Stage 2 share went from 25% to 42%.
Last week's weakest stocks gained 1.5% this week, last week's strongest lost 0.7%. Three of the past four weeks have gone to the laggards.
Quality held. Fresh Stage 2 entries rated 85 or higher: 31 this week, including KEX 92, AFRM 91, JLL 90, CTS 90, ASUR 89, WMB 89, CTOS 89, TEL 88, GBCI 88, HAYW 87, ENSG 87, RCL 86, UPS 86, MSM 86, HRI 85. Total Stage 2 names rated 85 or higher: 83, from 81.
Where the leadership is
Trading companies and distributors: 14 Stage 2 vs 6 Stage 4, median Mansfield RS +4.2, ED score 5.0, 74% beat the market.
Restaurants and leisure: 33 Stage 2 vs 35 Stage 4 (16 vs 56 two weeks ago), RS change +4.0, 86% beat the market, ED score 3.8 and rising.
Consumer discretionary overall: 40% in Stage 2, from 28%.
Utilities: 94% beat the market, 27 Stage 2 vs 29 Stage 4.
Energy equipment: 14 Stage 2 vs 16 Stage 4, 6 fresh entries, median Mansfield RS 0.0.
Banks lost ground after two strong weeks: Stage 2 count down from 74 to 62 with 18 fresh Stage 4 (BUSE, HOPE, FBP, TRMK, ZION), NU -23.4%. Health care equipment -2.3% with 35% beating the market, though LUNG, GKOS, KIDS and AXGN were among the week's best stocks.
How to position
The Stage 2 share (44.8%) is 7 points above its level four weeks ago (37.4%), so the hedge stays off; next week's reference is 37.8%. With Stage 2 vs Stage 4 at 0.97, the dial sits at the top of the 75% band and would move to 100% on a cross above 1.0.
Exposure belongs where breadth and quality are both rising: equipment rental and distribution, restaurants and leisure, autos, select aerospace and defense, utilities. Most of these entries are one to two weeks old, so sizing stays in tranches.
Large-cap tech is now the weak side. NVDA, GOOGL, AMZN, META and NOW are all below their 30-week averages. A rally led by those names would be a bounce inside Stage 4 until proven otherwise.
What to watch: whether Friday's 109 fresh Stage 4 extend into Monday, whether consumer cyclicals hold their fresh Stage 2 entries through the first pullback, the October jobs report, and any follow-through from the two Fed dissents in rate markets.
Leaders and laggards in replies.


1
5
716
Strongest this week, with ED score and structure:
Restaurants and leisure. ED score 3.8, RS change +4.0, median Mansfield RS -10.2, 33 Stage 2 vs 35 Stage 4, 86% beat the market. $BLMN +14.9% (ED 9), EAT +16.1% (ED 9), SG +12.7% (ED 8), WING +25.3%, DIN +14.2%. 17 fresh Stage 2 entries in one week. Cruise lines RCL, CCL and NCLH each gained 10 to 16%.
Trading companies and distributors. ED score 5.0, RS change +4.8, median Mansfield RS +4.2, 14 Stage 2 vs 6 Stage 4, 74% beat the market. $HRI +29.4% (ED 7), CTOS +17.0% (ED 8), ALTG +18.6% (ED 7), GATX +9.5%, AER +8.6%, URI +6.5% (ED 8). Equipment rental moved as a group.
Autos. ED score 2.2, RS change +2.1, median Mansfield RS -19.0, 7 Stage 2 vs 22 Stage 4, 66% beat the market. GM +15.1% (ED 8, fresh Stage 2), TSLA +7.4% (fresh Stage 2), HOG +7.8% (ED 9), DORM +8.6% (ED 8). The group is still mostly Stage 4; the leaders are the exception.
Aerospace and defense. ED score 2.1, RS change +4.3, median Mansfield RS -16.4, 7 Stage 2 vs 25 Stage 4, 86% beat the market. HII +15.6% (fresh Stage 2), VVX +8.5% (ED 7), GD +6.6%, TXT +11.5%, LHX +9.3%. Still a Stage 4 group on count.
Utilities. ED score 4.3, RS change +2.3, median Mansfield RS -4.8, 27 Stage 2 vs 29 Stage 4, 94% beat the market. WEC +4.5%, EXC +3.9%, SR +3.2%. Broad and steady rather than sharp.
Note: The two groups with both rising breadth and a Stage 2 majority are trading companies and restaurants. Autos, aerospace and construction are strong on the week but remain Stage 4 by count, so their moves are bounces until the stage counts change.


1
2
295
Weakest this week, large-cap tech:
Software. ED score 5.5, RS change -2.0, median Mansfield RS +8.2, 95 Stage 2 vs 30 Stage 4, 34% beat the market. NOW -33.9% (Stage 2 to Stage 4 in one week), $FTNT -24.4% (fresh Stage 4 after 28 weeks), TEAM -15.8%, DDOG -12.7%, ALKT -22.6%. The group still holds a Stage 2 majority; the damage is in the largest names.
Internet. ED score 3.1, RS change -2.0, median Mansfield RS -15.0, 10 Stage 2 vs 17 Stage 4, 33% beat the market. GOOGL -12.6% (Stage 3, 20% below the 30-week average), RDDT -36.4%, SNAP -15.8%, PINS -13.3%, MTCH -9.4%.
Technology hardware. ED score 3.6, RS change -3.6, median Mansfield RS +2.6, 8 Stage 2 vs 7 Stage 4, 31% beat the market. XRX -42.6%, HPQ -14.4%, DELL -7.0%, NTAP -7.6%, CRSR -8.2%.
Semiconductors. ED score 2.3, RS change +0.4, median Mansfield RS -14.9, 10 Stage 2 vs 54 Stage 4, 52% beat the market. INTC -24.4%, MRVL -14.1%, NVDA -3.0% and back in Stage 4. ENTG +14.8% (ED 8, rating 85) and NXPI +10.5% (ED 6) were the exceptions, both analog and materials rather than AI compute.
Banks. ED score 4.9, RS change -0.4, median Mansfield RS -0.6, 62 Stage 2 vs 51 Stage 4, 42% beat the market. 18 fresh Stage 4 (BUSE after 51 weeks, HOPE, FBP, TRMK, ZION), NU -23.4%. The regional bank entries of two weeks ago are being tested.
Note: The weakness is in the index heavyweights, software, internet and AI compute, while stage breadth across the whole market improved. That combination explains the Nasdaq -2.0% against a median stock +0.8%.


3
105


Another Trendspotting idea working, from the October 19 report: Janome (6445 JP) up 18% today as the company raises the dividend and increases the buyback. Earnings next week should confirm.


What an excellent entry point the market gifted us yesterday for $WELL, 187 weeks in Stage 2
Shankh Mitra: “However, as communities are filling up, the deliberate and methodical handover from occupancy to pricing as the driver of revenue growth is taking place under the surface. Our all-in measure of pricing or RevPOR or unit revenue increased by 5.3% during the period, highlighting the strong pricing power maintained by our operators.”


4
452
$WELL continues to deliver so it’s a good time to add


