

Research consortium analysing the #cyber threat environment. By @UniHeidelberg, @uniinnsbruck & @SWPBerlin. Funded by @AuswaertigesAmt & @DanishMFA. #cybersec
- Tweets369
- Following406
- Followers658
- Likes95
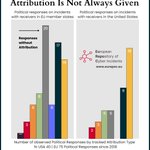






ALT Bar chart depicting the distribution of political responses to cyber incidents for receivers in EU member states and the United States, categorized by attribution basis. Incidents affecting EU member states show 20 political responses without attribution, compared to only 5 for the United States. This suggests that while EU member states have a higher overall frequency of political responses, the relationship between attribution and political response differs between the EU and the United States.

ALT This line chart visualizes the cumulative total of espionage, DDoS/defacement, and ransomware operations conducted by Russian-origin threat actors from 2012 onwards. Espionage operations show steady growth throughout the period, while DDoS/defacement operations experience a sharp rise starting in 2022. Similarly, ransomware operations also begin to increase during this timeframe.


ALT The scatter plot displays the relationship between the number of cyber incidents affecting various sectors in EU Member States (X-axis) and the number of EU media reports covering those incidents (Y-axis). A correlation line illustrates the general trend: sectors with more incidents tend to receive more media coverage. However, certain sectors stand out—incidents involving political parties and the health sector receive disproportionately high media attention, while sectors like finance and law enforcement are underreported compared to the average. This suggests a disparity in media focus depending on the sector impacted by cyber incidents.


ALT An area chart highlighting the distribution of single attributions against joint attributions. It shows that single attributions remain the most prominent since 2022, with joint attributions being quite rare.


