
Draft FPL manager. Balancing long term and short term strategies.
Joined August 2021
- Tweets229
- Following181
- Followers464
- Likes71





Time for the annual post - Let's talk GK rotations!
TLDR:
· Higher the number, the more favourable the fixture rotation.
· Based over ALL 38 GWs.
· 88 'perfect' score.
· Spurs with lots of good pairings.

A score of 88 for a rotation is perfect, with the pair of teams not playing the promoted teams in the same GW or the top 6 clubs in the same GW.
For reference, only playing the same GK from a mid table team would score 64.
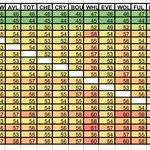
The original matrix provides a number which is the sum of the best GK fixture each game week for the 2 teams. It is therefore the predicted sum of the 2 GKs if there rotation was perfect and the only factor was opposition.
Newly promoted clubs have all been given an PPG of 4.27.
Home and away.
When looking at differences between home and away performances there was minimal difference GKs scores at home ore away.
Surprisingly 14/20 teams preformed better when playing away than at home.
It has not been factored in to the matrix.
FPL Draft - GK fixtures matrix.
This matrix shows the best pairings of teams for GKs with complimentary fixtures over the 38GWs.
TLDR:
1. Not huge variation across the season.
2. Avoid drafting Sels and Areola together.
3. Palace have some good combos.

High GK PPG allowed teams.
As expected the relegated teams were high on the GK PPG allowed.
Not as expected Man Utd were top with 4.27. This could be due to a combination of poor finishing and taking lots of long shots allowing multiple easy GK save points.
Method
In order to best predict points I used the data from 24/25 season, and totalled the number of FPL points each team conceded to opposition GKs.
I only included matches where the GK played a full 90mins (not subbed) and took an average to give PPG conceded to GK.

This seems to be my main yearly contribution to the draft.
Last year @Draft_FC and @SnakeDraftFPL both did some work
Background.
GKs have 2 primary ways of point scoring:
1. Clean sheets - more likely to accumulate vs poor opposition attacks.
2. Saves and BPS - more likely to accumulate vs strong opposition attacks.
Therefore a paradox in using fixtures to predict points.
Inspired by the Athletic’s football pod talking about the statistical correlation between PL position after 10GWs and final position - Spoiler it’s 77% - I decided to look into the data for my 10 person draft FPL league over the past 4 years. 🧵


🚨MONDAY POD!🚨
Sensational PL weekend, broken down by @acjimbo, @danielstorey85, @jaydmharris, @MarkCarey93 & @SJohnsonSport:
🍒Bournemouth beat Man City with @afcbpodcast
🔴Liverpool top
🌳Forest are 3rd!
🔥Spurs smash Villa
💸Arsenal's bad business?
pod.fo/e/27d66c
As usual raw data used from @Draft_FC.
Each of the 38 plots on the overall line only has 40 data points to determine the correlation. I would expect the line to smooth out with more data points.
Looking at the overall correlation there is a spike in correlation at the 10 GW point - Up to 65%.
Predictably lower than the real life PL due to being a lot more luck based.
This number goes up to 80% at GW 29.