

The analysis and conclusions set forth are those of the authors and do not indicate concurrence by other members of the research staff or the Board of Governors
- Tweets2.9K
- Following7
- Followers23K
- Likes0
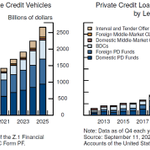




ALT The graphic contains two stacked bar charts displayed side by side: Left Chart: • Title: "Total Financial Assets of Private Credit Vehicles" • Y-axis: Billions of dollars (scale 0-2500) • X-axis: Years from 2013 to 2025 • Shows annual data with stacked bars in six colors representing different lender types Right Chart: • Title: "Private Credit Loans to U.S. Businesses, by Lender Type" • Y-axis: Billions of dollars (scale 0-1600) • X-axis: Years from 2013 to 2025 • Shows annual data with stacked bars in six colors representing the same lender types Legend (applies to both charts): • Internal and Tender Offer Funds (white/light) • Foreign Middle-Market CLOs (gray) • Domestic Middle-Market CLOs (light blue/teal) • BDCs (blue) • Foreign PD Funds (purple) • Domestic PD Funds (dark blue/navy) Notes: Both charts indicate "Data as of Q4 each year" Source: September 11, 2026 release of the Z.1 Financial Accounts of the United States and SEC Form PF


ALT Figure 3. Mean allocation by income and wealth group. Chart shows mean allocation across income/wealth percentiles.

ALT Figure 2. Participation in Informal Financial/Caregiving (F/CG) Support Networks by Wealth Decile. Chart shows stark wealth divide in family/caregiving support.

ALT Figure 3. Mean allocation by income and wealth group. Chart shows mean allocation across income/wealth percentiles.


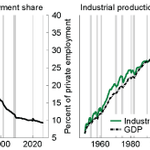
ALT Figure 1. Measures showing declining importance of goods production

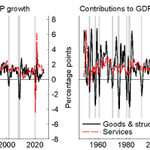
ALT Figure 2. Goods production drives the business cycle

ALT Figure 6. Goods GDP has grown faster than goods-industry value added