

In crypto since 2019 | Alpha Research | I print while they cope.
Join my TG →
Joined November 2024
- Tweets6.1K
- Following136
- Followers4.8K
- Likes14.3K


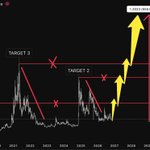
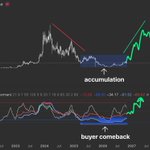



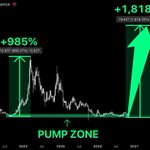

$INJ at $8.45 is starting to tell a different story.
For months, every bounce was sold. Now price is holding a base
and weekly RSI momentum is climbing back above 50.
That's the kind of shift I pay attention to.
The interesting part isn't the $60 target on the chart.
It's that buyers might finally be gaining control after a long period of accumulation.
If $INJ starts reclaiming $12–15
I think the move could get aggressive fast.
I'd rather catch the first signs of a trend change
than chase it once everyone agrees it's bullish.

$SEI at $0.048 is the kind of chart that makes even the bulls uncomfortable.
And that's precisely why I'm paying attention.
After nearly three years of getting destroyed
price is barely moving near its lows.
The question is whether sellers are finally running out of ammunition.
If we get a proper reversal
I'm watching $0.39, $0.73, and $1.14.
The $1.90 scenario?
That's where things get ridiculous.
But don't confuse a potential 50x with a guaranteed opportunity.
Sometimes the market gives you a second chance.
Sometimes it gives you another lesson.

$XLM has a fascinating habit
of making everyone bullish right before crushing their expectations.
2018. 2021. 2025.
Different cycles, same story.
Explosive rallies followed by brutal reversals.
But here's what interests me.
$0.35, $0.64, and $0.79 are the levels
where sellers previously took control.
If $XLM starts reclaiming them
the entire narrative changes.
And suddenly $1.30 doesn't sound so crazy anymore.
I think the next real breakout could catch a lot of people completely off guard.

$INJ is starting to look interesting again.
Not because of some ridiculous $60 prediction
but because of what's happening underneath the price.
Almost two years of sideways action, sellers losing momentum
and the first signs of buyers stepping back in.
That's usually where my attention goes.
The $15–17 range is the real test.
Break that, hold above it, and I think $INJ could surprise a lot of people.
The best setups rarely look exciting before they actually move.

$SUI at $0.91 is starting to look strangely familiar.
Remember what happened in 2024?
A quiet accumulation zone turned into an 837% rally.
Now price is back near that same area, and almost everyone has lost interest.
Two zones. One very interesting pattern. 👀
Could $SUI repeat history and push toward $6–7?
That's my aggressive bull-case scenario, not a guarantee.
The first rally made everyone a believer.
The second one, if it happens, will probably start when nobody believes anymore. 💀

$FIL at $0.85 is one of those charts
that looks completely hopeless.
And that's exactly why I keep checking it.
Years of selling.
Almost no momentum.
Price practically glued to the floor.
But imagine a real reversal from here.
$119 → $237 → $430.
Over 40,000% in the most extreme bull-case scenario.
Absolutely insane.
I'm not calling the bottom yet.
But if $FIL finally wakes up
this could become one of the wildest comeback stories in crypto.

$DASH at $46 might be one of the most forgotten charts in crypto.
Back in 2021, people were chasing it above $400.
Now? Years of sideways movement. Almost zero attention. 💀
But that massive base on the weekly chart is hard to ignore.
$200 → $500 → $1,600 is my extreme bull-case scenario.
That's a potential 35x from here.
Will it happen? No guarantees. $DASH still needs a real trend reversal.
But it's funny how everyone wants a 100x gem
while ignoring coins that have been building a base for years.

$XLM is one of those alts
that makes you question why you ever doubted it.
Years of sideways action.
Everyone calls it dead.
Then suddenly it starts moving like it's 2021 again.
And I'm seeing a familiar setup.
$0.35 → $0.64 → $0.79.
But $1.30+ is where things could get really interesting.
That's a potential 8x in my aggressive bull scenario.
The funniest part?
Nobody cares about $XLM at $0.16.
At $1, they'll call it the future of finance.

$RENDER has already shown what happens when this market remembers AI exists.
Last cycle: +985%.
Then it crashed right back to $1.50. Almost like the entire rally never happened. 💀
Now we're sitting near the same zone where the previous explosion started.
And I'm looking at $20 as the extreme bull-case target.
Another 10x+ comeback isn't guaranteed, but the setup has my attention.
The market loves AI until it's time to buy an AI coin nobody wants.

$FET is making the entire AI narrative look like a joke right now. 💀
From $3+ to $0.15.
Almost all the hype has been wiped out.
But here's the part I find interesting.
The weekly chart is transitioning from a brutal downtrend into a long, boring base.
If that base turns into a real reversal
$5 becomes my extreme bull-case target.
30x+ upside potential.
The AI hype isn't enough.
Now $FET needs to prove it can actually move.

$SEI at $0.047 is the kind of chart nobody wants to touch anymore. 💀
Down nearly 96% from its highs.
Hype gone.
Buyers exhausted.
But that weekly floor has my attention.
$0.39 → $0.73 → $1.14.
And $1.90 is the absolutely ridiculous bull-case target.
A potential 40x comeback if momentum ever returns.
The irony? If $SEI starts pumping
the same people ignoring it at $0.05 will be calling it the next big thing at $1.

$PYTH has spent two years turning every hopeful buyer into a long-term investor. 💀
From $1.15 to $0.063. Absolutely brutal.
But something about this weekly setup is catching my eye.
The downtrend is flattening, price is holding near a major historical floor
and the upside levels are pretty wild.
$0.24 → $0.54 → $1.15.
A potential 20x+ comeback if the bullish scenario plays out.
The real question is whether $PYTH can finally give holders something other than character development.

$DASH at $48 with a $1,600 target.
A 33x from here. On an alt most people forgot even exists. 💀
But look at the weekly.
Years of trading near the floor, endless boredom
and a massive historical base.
If $DASH finally breaks out, this old dinosaur could surprise the entire market.
$1,600 is the dream scenario, not a guarantee.
But I'd love to see the chaos if this thing actually wakes up.

$LUNC might be the most hated comeback story in crypto.
Years of bleeding, endless failed rallies
and now trading at $0.000042 like nobody even remembers it exists. 💀
But that weekly base is hard to ignore.
$0.00018 → $0.00028 → $0.00065.
A potential 15x if the bullish scenario actually plays out.
Everyone calls it dead.
Which would make a comeback even funnier.

$LIT might be setting up for an absolutely ridiculous comeback.
Ran to $5, pulled back to $3.25
and now we're sitting right at a potential reversal zone.
If buyers defend this level
$10 is back in the conversation.
$20? That's my full-degen bull-case target. 👀
A potential 6x from here.
Funny how nobody wants these charts at $3
but everyone suddenly becomes a genius buyer at $15.

$INJ might have one of the wildest unfinished stories in crypto.
2021: $25.
2024: $50.
Next cycle: $95? 👀
And here we are, trading at $7 like none of that ever happened.
The weekly is sitting near a critical long-term floor
with a potential third cycle peak pointing toward $100.
A 13x comeback from here would be absolutely ridiculous.
But first, bulls need to prove this isn't just another dead-cat bounce.

Every few years, $XLM remembers it's allowed to pump.
2018. 2021. And now we're looking at 2027. 👀
Back at $0.17, with another long stretch of boring price action behind us.
The next big cycle target on this chart? $2.
Sounds ambitious, but here's what I find interesting.
$XLM has already surprised this market more than once.
Wouldn't be shocked if it did it again.

$STX has done this twice already.
2020: Dead chart. Massive rally.
2023: Same story. Another explosion.
2026: Here we go again? 👀
Trading at $0.32, right inside what could be the third major accumulation zone.
If history repeats, $3–$5 is my aggressive bull-case range.
That's a potential 15x.
Of course, first we need buyers to actually show up.
But three times would be one hell of a coincidence.


$SUI might be setting up for the exact same madness all over again.
First accumulation zone → +837% rally.
Now we're back near that same price area
with another potential 900% move on the chart.
$3 first. $6 if things really get out of hand.
I'm not saying history has to repeat itself.
But imagine getting a second chance at a setup that already delivered once. 💀
