$Trader (@GDXTrader) header
$Trader (@GDXTrader) profile picture

Experienced and veteran stock trader who specializes in mentoring gold and commodity traders, focusing on technical analysis. Discord https://nitter.gq/t.co/gNHZigJIBw

Canada
Joined August 2010
Photo by $Trader (@GDXTrader)Photo by $Trader (@GDXTrader)Photo by $Trader (@GDXTrader)Photo by $Trader (@GDXTrader)Photo by $Trader (@GDXTrader)Photo by $Trader (@GDXTrader)Photo by $Trader (@GDXTrader)Photo by $Trader (@GDXTrader)Photo by $Trader (@GDXTrader)Photo by $Trader (@GDXTrader)
𝐆𝐨π₯𝐝𝐞𝐧 πŸ‘οΈ - π—˜π—©π—˜π—₯π—¬π—§π—›π—œπ—‘π—š π—œπ—‘ π—’π—‘π—˜ π— π—˜π— π—•π—˜π—₯π—¦π—›π—œπ—£ Video recaps after every close, the key levels I'm watching, my real-time trade alerts, a private Discord, step-by-step education and the journal. All of it, in one membership. Get the whole package for $5.97 USD/month at goldeneyeanalysis.com #GOLD #SILVER #COPPER $XOM $OIL #PALLADIUM $PALL $GC #PLATINUM $SLV $AG $GLL $GOLD $FCX $DXY $GDX #DXY $BTC $URNM $SILJ $COPX $UDN
1,596
$BTU $BTU bears remain in control, with another bearish continuation candle so far this week as price tests horizontal support near $20.35. Price is down 5.05% at $21.06 so far this week, below both the 50 EMA at $25.68 and the 200 EMA at $23.66, and still inside the descending channel. The MACD is following price lower, at -1.15 against the signal at -0.8079. This one is on breakdown watch. Struggling to profit on $BTU or the #COAL sector? Get access to a full trading course platform with entry signals and key levels, my chat room, my exclusive setups and more. Join us at goldeneyeanalysis.com. Come check us out on Discord and start your free trial, see what we're all about firsthand: discord.com/invite/e4PEY2UcE… #COAL #ENERGY #METALLURGICALCOAL $AMR $HCC $CNR $ARLP $NRP $METC $NC $SXC $WHITF $YACAF $XLE $XOP $XOM $CVX $COP $OXY $VST $NRG
2
597
$U.U - #URANIUM $U.U range is tight, with a doji candle so far this week sitting mid range at the apex of the symmetrical triangle. Price is down 0.93% at $19.23 so far this week, sitting on a flat 50 EMA at $19.20. The MACD is following price sideways, at -0.083 against the signal at -0.052, and the RSI is flat near the midline at 49.39. A weekly close outside the triangle could set the next direction. This one is on breakout watch. Tired of guessing on $U.U? Access our trading plan framework and build a plan that fits you. Join us at goldeneyeanalysis.com. #URANIUM #NUCLEAR #ENERGY #URANIUMSTOCKS $URNM $URNJ $CCJ $UEC $UUUU $DNN $NXE $EU $URG $PALAF $DYLLF $GLATF $FCUUF $BQSSF $ISOU $BNNLF
1
627
$ASPI $ASPI printed an inside range candle last week, and so far this week bulls aren't stepping in to confirm the pivot. Confirmation would be a weekly close above the mother bar's high. Instead, price is putting in another bearish continuation candle so far this week, down 6.19% at $1.90. Price is sitting just above horizontal support near $1.82, the 2024 lows, and well below the 50 EMA at $4.71 and the 100 EMA at $5.09. The MACD is following price lower, at -0.9618 against the signal at -0.8190, and the RSI is under 30 at 29.43. This one is on breakdown watch. Every $ASPI trade needs a plan: entry, stop and target. See mine, and learn the framework to build your own. Join us at goldeneyeanalysis.com. #NUCLEAR #URANIUM #SMALLCAPS $NNE $LEU $NXE $CCJ $SMR $OKLO $BWXT $LTBR $CEG $NLR $URA $UEC $UROY $SRUUF $MP $USAR $UAMY $LAC $IWM
3
591
$MARA $MARA could be setting up for a bounce here, as price tested horizontal support near the February lows and is up 9.64% so far today. Today's candle is a signal reversal in the form of a Fred Tam candle, opening inside the prior red candle and pushing back above support to $7.05. I'm also watching a bullish divergence on the RSI, with price making a lower low while the RSI held a higher low. The MACD is following price and is right at a bullish cross, with the MACD at -1.05 and the signal at -1.06. This one goes on my pivot watch list. The weekly timeframe remains very bearish, so measuring bounce momentum is key here. Stop trading $MARA on emotion. Get my setups, entry and exit levels, and a full framework to help you build a consistent trading plan. Join us at goldeneyeanalysis.com. Come check us out on Discord and start your free trial, see what we're all about firsthand: discord.com/invite/e4PEY2UcE… #BITCOIN #CRYPTO #BTCUSD $BTC $RIOT $BITF $HIVE $BTBT $CAN $GREE $IREN $CORZ $BTDR $MSTR $COIN $BITO $WGMI $BITX $APLD $BLOK $DAPP $BKCH
1
884
#BITCOIN #BITCOIN's indecision candle so far today has turned into a stronger signal, a piercing line at the 200 EMA at $76,459. Price is up $1,010 so far today at $77,684. If we close with a piercing line, or even better a bullish engulfing candle, #BITCOIN goes on bullish pivot watch tomorrow. If we get confirmation, I might take this trade and share my entry and exit with my goldeneyeanalysis.com subscribers. Stay tuned. #CRYPTO #BTCUSD #ETH $BTC $IBIT $FBTC $ARKB $BITB $HODL $BRRR $EZBC $MSTR $COIN $HOOD $CLSK $HUT $IREN $CIFR $WULF $CORZ $BTDR $GLXY
1
1
869
$Trader retweeted
$DXY $DXY bears have been in slight control of this consolidation pullback since the Fred Tam confirmation pivot, as we anticipated in the post below. Today we have an inside range candle, flat at $101.81, as we hold the neckline of a double top. The dark cloud cover last week put in the second top under rising resistance. The question now is whether we just do a rectangular high base sideways consolidation for the next break to the upside, or break the support level of this double top and move towards a measured double top breakdown move. No directional bias short term until this is resolved. Do you trade $DXY or the #FOREX sector? So do we. Come access our entry and exit alerts, chat room and more at goldeneyeanalysis.com. Come check us out on Discord and start your free trial, see what we're all about firsthand: discord.com/invite/e4PEY2UcE… #GOLD #SILVER #XAUUSD $UUP $UDN $FXE $FXY $FXB $FXC $EURUSD $USDJPY $GBPUSD $USDCAD $GLD $TLT nitter.gq/GDXTrader/status/21110…
$DXY $DXY: In our previous post, we highlighted an inside-range candle signaling consolidation, but yesterday’s session ultimately produced a bearish Fred Tam reversal signal, with price gapping within the prior bullish candle and closing below its open. Today, we’re seeing bearish confirmation follow-through, establishing a potential pivot high reversal and increasing the probability of further consolidation or a pullback. Momentum indicators are reinforcing the bearish thesis, with the MACD crossing below its signal line while the RSI bearish divergence we previously highlighted warned of weakening buying pressure. This combination of bearish price action and deteriorating momentum suggests buyers are losing control as sellers gain conviction. Bears are building momentum, and the risk of further downside is increasing. Learn price action-focused technical analysis for just $0.15/day at goldeneyeanalysis.com/playbo…. Get exclusive charts, alerts; key setups, and a private X community to boost your trading confidence. Plus, access our daily commodity video newsletter covering #GOLD, #SILVER, #BITCOIN, #URANIUM, #COPPER, #CL, #COFFEE and more with price action coaching. Join hundreds of traders today at goldeneyeanalysis.com. $UUP $UDN $EURUSD $USDJPY $GBPUSD $USDCHF $USDCAD $AUDUSD $NZDUSD $FXE #EURUSD #GBPUSD #AUDUSD #USDCAD #USDCHF #NZDUSD #EURJPY #GBPJPY #AUDJPY #EURGBP #EURCHF #GBPCHF #CADJPY #CHFJPY #EURAUD
2
5
1,705
𝐆𝐨π₯𝐝𝐞𝐧 πŸ‘οΈ - π—£π—Ÿπ—”π—§π—œπ—‘π—¨π—  𝗒π—₯ π—£π—”π—Ÿπ—Ÿπ—”π——π—œπ—¨π— : π—ͺ𝗛𝗒'𝗦 π—Ÿπ—˜π—”π——π—œπ—‘π—š? Platinum futures divided by palladium futures, weekly candles. Two industrial precious metals, one relative-strength read. TradingView: NYMEX:PL1!/NYMEX:PA1!, 1W, SMA 10 & 40, RSI 14 Rising line = platinum stronger. Falling line = palladium stronger. - Higher lows since the Jul 14 2026 low (1.256): Aug 6 1.259, Sep 3 1.282, Oct 15 1.437 - Broke above the Oct 13 high (1.483) on Oct 20 - Holding near the Oct 28 peak (1.533), the highest daily close since Nov 2016 - Above the 10-week (1.430) and 40-week (1.351) averages, 10-week over the 40-week since September - Weekly RSI 65, firmly above 50 - Since the Jul 14 low: platinum -10.6%, palladium -25.7%, ratio +20.3% Leader: PLATINUM. Laggard: palladium. Follow the strength, not the headlines. Get access to our library of strategies by signing up at goldeneyeanalysis.com. #PLATINUM #PALLADIUM #GOLD #SILVER $PALL $PPLT $GLD $GC $SLV $SILJ $PAAS $NEM $AG $GDX $GDXJ $XAUUSD $UGL $GLL $COPX $FCX
752
$Trader retweeted
#PLATINUM #PLATINUM is putting in a small spinning top so far today at $1,425.87, after breaking horizontal support near $1,490. Bears are still in control of this pullback, and until we reclaim overhead horizontal resistance near $1,490, it's patience for new entries. We either want to see a bottoming pattern here with a break of structure back to the upside, or a strong Japanese candlestick pivot with momentum. The RSI at 26.44 is under its moving average at 33.63, and the MACD is below zero with the MACD line under the signal line. Not sure how to track momentum on a bounce in a downtrend? Get our momentum guide in our chat room at goldeneyeanalysis.com. Come check us out on Discord and start your free trial, see what we're all about firsthand: discord.com/invite/e4PEY2UcE… #PALLADIUM #GOLD #SILVER #XPTUSD $PPLT $PLTM $PLG $SBSW $IMPUY $ANGPY $PALL $SPPP $GLTR $GLD $SLV $PSLV $GDX
1
3
1,209
$Trader retweeted
#PALLADIUM #PALLADIUM put in another bearish continuation candle today, down about 2.3% at $942, as we now break descending support. The RSI is at 18, the most oversold we've been in years. There's been no reason to buy palladium since before September, with price sliding further below the 50 EMA at $1,157 and the 200 EMA at $1,305. Bears have had full control. This is an assault. Is the RSI going to zero? It could stay this low for a long time. There's no reason to buy or try to catch a falling knife here, because if you've done so over the last two months, you're in a world of pain. Patience here. Riding #PALLADIUM or waiting for the next setup? Get access to our chat room and technical post-market video recaps. Join us at goldeneyeanalysis.com. Come check us out on Discord and start your free trial, see what we're all about firsthand: discord.com/invite/e4PEY2UcE… #PLATINUM #GOLD #SILVER #XPDUSD $PALL $SPPP $PPLT $PLTM $SBSW $IMPUY $ANGPY $NILSY $GLTR $GLD $SLV $IAU $PSLV $GDX
4
8
1,503
$Trader retweeted
#NATGAS #NATGAS put in a spinning top on Friday, and yesterday we couldn't get a confirmation close above the spinning top's high. Today we have an inside range candle, up about 1.9% so far at $2.605, just above horizontal support at $2.464. The level seems interesting, and the risk reward could possibly work on a new setup here. But with so much overhead resistance, all three moving averages stacked above from $2.777 up to the 200 EMA at $3.035, and the higher timeframes under bearish momentum, we don't want to force a trade. We'd rather wait until we have the odds in our favour for a nice bounce. As much as the level is holding from a technical Japanese candlestick perspective, which is our edge in the marketplace, we're going to be patient for the time being. I'll review how #NATGAS closes post-market with our subscribers at goldeneyeanalysis.com. #ENERGY #LNG #OIL $UNG $BOIL $KOLD $FCG $EQT $AR $RRC $CTRA $CNX $EXE $LNG $CRK $GPOR $KMI $WMB
2
10
1,984
𝐆𝐨π₯𝐝𝐞𝐧 πŸ‘οΈ - 𝗬𝗒𝗨π—₯ 𝗧π—₯π—”π——π—œπ—‘π—š 𝗗𝗔𝗬, π— π—”π—£π—£π—˜π—— 𝗒𝗨𝗧 Key levels before the open, my alerts during the session, chart requests any time and a video recap after the close. On weekends we zoom out to the weekly and monthly charts. Start your next session with us for $5.97 USD/month at goldeneyeanalysis.com #CL $USO #XAUUSD $BTC $UUP $FCX $XOM #PALLADIUM $AG #PLATINUM $URNJ $SILJ $DXY $BITO #GOLD $COPX #SILVER $UGL $PAAS $GOLD #BITCOIN $GDXJ
866
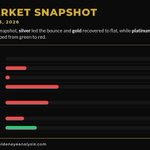
𝐆𝐨π₯𝐝𝐞𝐧 πŸ‘οΈ - 𝗣π—₯π—˜-𝗠𝗔π—₯π—žπ—˜π—§ 𝗦𝗑𝗔𝗣𝗦𝗛𝗒𝗧 Metals bounced hard since ~7:30 AM, but $WTI flipped from green to red. Silver cut its loss from 2.97% to 0.97% and is back above $50 at $50.16. Gold recovered to flat near $3,947, platinum eased to βˆ’0.20% at $1,441, and copper trimmed to βˆ’1.99% at $6.44. Palladium is still soft at βˆ’2.46% ($941.80). $WTI flipped to βˆ’0.86% at $96.42, while natural gas stays green at +1.45% ($2.593). Want these setups broken down daily in a post-market video recap? Join us at goldeneyeanalysis.com πŸ‘οΈ #GOLD #SILVER #COPPER #CL #PLATINUM #PALLADIUM $GLD $GC $SLV $SILJ $COPX $FCX $PALL $WTI $USO $UCO $OIL $XOM $GDX $GDXJ $NEM $PAAS
1
944
🚨 New subscriber promo: join now and get my full trading plan FREE, plus courses, chat room, daily recaps and trade alerts. πŸ‘‰ goldeneyeanalysis.com
1
2
908
#GOLD #GOLD is putting in a nice reversal off the lows at descending channel support, up $19.16 so far today at $3,965.90. Yesterday we had an inside range, and today's lower wick bullish continuation candle gives us a double inside range to Friday's long range marubozu candle. The candlestick setup doesn't change here. We have a double inside range, and bulls want to see a close above the mother bar's high to show we've absorbed all of Friday's supply. From there, I can look for a pivot reversal and measure strength to the upside. Want a plan for #GOLD before the move, not after? Get my setups, entries and risk, plus a full framework to build your own trading plan. Join us at goldeneyeanalysis.com. Come check us out on Discord and start your free trial, see what we're all about firsthand: discord.com/invite/e4PEY2UcE… #SILVER #XAUUSD #MINING $GDX $GDXJ $UGL $GLL $NEM $AEM $KGC $AU $AGI $FNV $WPM $RGLD $GLD $SLV
3
1,220
$FCX $FCX needs care here following the breakdown of ascending support. Yesterday we had a retest of prior support that held as resistance. We put in a shooting star candle at $62.97, not being able to reclaim the 50 EMA at $68.88. We also closed below the 200 EMA at $63.66, which is now overhead resistance too. Pre-market is at $61.43. Until we reclaim overhead resistance levels, bears are in control following this break of structure. The MACD is below zero with the MACD line under the signal line, and the RSI at 32.63 is under its moving average, both following price lower. Trade $FCX with a plan: my setups, entries and risk, and a full framework to help you build a successful trading plan. Join us at goldeneyeanalysis.com. Come check us out on Discord and start your free trial, see what we're all about firsthand: discord.com/invite/e4PEY2UcE… #COPPER #BASEMETALS #MINING #HG $COPX $COPJ $CPER $SCCO $TECK $HBM $ERO $IVN $RIO $BHP $VALE $CS $TGB $FM
2
993
$SKE $SKE lost its ascending channel a few weeks ago, and so far this week we're now losing the 50 EMA at $27.74, trading at $27.17. There is no clear bottoming pattern or real levels that price is holding for the time being. Patience here moving forward. Bears are in control. Trading $SKE alone? Join my chat room for alerts, levels and daily videos at goldeneyeanalysis.com. #GOLD #SILVER #XAUUSD #MINING $GDX $GDXJ $SIL $SILJ $NEM $AEM $KGC $AGI $EQX $NGD $IAG $PAAS $AG $GLD
1
920
$SVM $SVM lost horizontal support last week. So far this week we have an inside range doji candle, up about 2.51% at $8.16, as we hold below prior horizontal support at $8.53. That's 6 weeks of lower closes here, with price now below the 50 EMA at $9.93. Bears are in control. The MACD continues to expand to the downside below zero, following price lower and confirming the selling. There's no setup here. Want my levels on $SVM in a centralized platform, plus my #SILVER setups broken down daily in a post-market video recap? Join us at goldeneyeanalysis.com. Come check us out on Discord and start your free trial, see what we're all about firsthand: discord.com/invite/e4PEY2UcE… #PRECIOUSMETALS #SILVER #XAGUSD $SLV $SIL $SILJ $PAAS $AG $HL $CDE $FSM $MAG $EXK $GATO $SSRM $PSLV $GDX
2
920
$WTI Last week we talked about the gravestone doji at horizontal resistance. Following today's headlines, $WTI breaks below the 50 EMA and ascending support. The headlines and the technicals aligned, and now we have a breakdown. This is a change of character as we lose the 50 EMA at $95.65 and ascending support for the first time with conviction so far today. We'll see how we close and whether bulls can reverse this. The gravestone doji that got confirmed yesterday gave its anticipated follow-through, and now we lose support. The MACD histogram just turned negative, following price lower. Trade $WTI with structure: my key levels, entries and stops, plus a full course to help you build a trading plan that fits you. Join us at goldeneyeanalysis.com. #OIL #CL #ENERGY #CRUDEOIL $USO $USL $DBO $XLE $XOP $MPC $VLO $PSX $CVE $SU $CNQ $IMO $FANG $EQNR
4
1,246
$Trader retweeted
𝐆𝐨π₯ππžπ§πŸ‘οΈ - π“π‘πž 𝐁𝐞π₯𝐭 𝐇𝐨π₯𝐝 π‹π’π§πž 𝐄𝐱𝐩π₯𝐚𝐒𝐧𝐞𝐝 Join us at goldeneyeanalysis.com to learn trading strategies, Japanese candlestick patterns, and concepts for building a disciplined trading plan. Access our chat room and some of my personal trades, with daily technical video reviews of commodities and technical analysis coaching. For traders who trade the following markets, we provide daily technical-analysis video coaching and reviews, breaking down price action, candlestick setups, momentum, key support and resistance levels, risk/reward, and potential trading opportunities: #GOLD #SILVER $DXY $GDX #URANIUM #COPPER #COCOA #COFFEE #NATGAS #PALLADIUM #PLATINUM $URA #WTI #CL #BITCOIN #ES.
1
1
3
1,334
$Trader retweeted
$SLI $SLI continues to struggle at ascending support, down 2.78% at $1.40 so far this week. The level is interesting, but without pivot low confirmation, patience is required for an entry. Price is well below the 50 EMA at $2.72 and the 200 EMA at $2.87, with the 50 now under the 200, and the RSI is weak around 26. Bears are still in control, and this is at risk of a full breakdown if we don't bounce here. Tired of guessing on $SLI? Access our trading plan framework and build a plan that fits you. Join us at goldeneyeanalysis.com. #LITHIUM #EV #BATTERYMETALS $LIT $ALB $SQM $LAC $LAAC $PLL $SGML $PMET $ATLX $IONR $ELBM $SLDP $QS $BATT
3
1,175