

🇦🇷 | Swing trader since 2010 | Charts-focused TA (some macro) | Market psychology | Trading - Bitcoin, Gold, Stock Indices & DeFi | NFA - I don't have a TG!
Free Occasional Analysis →
Joined November 2015
- Tweets9.4K
- Following274
- Followers3K
- Likes16.1K





Pinned Tweet
$BTC - Roadmap Update
I’ve made some slight adjustments to my roadmap to make it more precise through the next halving in 2028.
I’ve lowered the projected cycle/macro bottom. Initially, I was targeting the mid-50s, but after reassessing recent macro and monetary developments, combined with this violent price action brushing the 60k zone, I now believe it’s highly probable we see a macro bottom in the 40s between August - October.
As shown on the chart, I’m projecting a possible new ATH in the first half of 2027.
As I’ve explained before, the permabulls claiming that “this cycle is different” were completely wrong since they expected the bull market to continue into 2026, while I warned about a bear market this year, but also about a structural shift in Bitcoin’s cycle timing toward 2027/28.
We’re going through a period of structural change in monetary policy and liquidity flows.
After a decades-long downtrend in interest rates, the Federal Reserve broke that trend in 2022 with the fastest and most aggressive hiking cycle in history.
At the same time, the U.S. Treasury is shifting toward issuing more short-term debt and less long-term debt.
We also know that the Fed’s balance sheet is undergoing a structural transformation, increasingly composed of short-duration assets.
That said, I believe it’s only a matter of time before the Fed implements some form of policy to control long-term yields (10Y) , likely in H2 2026, or possibly toward year-end.
Since the nomination of Kevin Warsh as a potential successor to Powell, markets have reacted negatively, given his reputation as a more orthodox, anti-QE economist.
However, I’m convinced that if liquidity conditions deteriorate or bank reserves approach critical levels, political pressure would eventually force even someone like Warsh to take decisive action.
Just as we saw an ATH in 2024 before the halving, I believe Bitcoin cycles may begin to follow a new dynamic, where investors front-run the halving, rather than waiting for it to happen before accumulating BTC.
#Bitcoin


I created this #Bitcoin roadmap in early December, and so far my view hasn’t changed.
Since mid-October, after the 10/10 crash, I started warning about the possibility that 126k was the cycle top and that we were entering a corrective phase toward 80k (pinned post).
While I was convinced of this scenario, I didn’t expect it to unfold so fast.
That sharp and violent drop was, in my opinion, a signal to broader markets.
$BTC often front-runs most assets.
This is my third Bitcoin cycle, and over the years I’ve studied the asset deeply and the fundamental drivers behind its price appreciation. I’ve come to understand that Bitcoin is essentially a pure liquidity asset, almost a perfect barometer of global liquidity.
It’s important to clarify that M2 and liquidity are not the same thing. Just because M2 keeps rising doesn’t mean that money supply is truly liquid. And even when liquidity exists, it doesn’t necessarily flow directly into Bitcoin or financial markets.
That’s why understanding liquidity cycles, driven by debt and sovereign bond restructuring, is crucial.
For those claiming that Bitcoin 4-year cycle no longer exists or makes no sense, I’d suggest studying liquidity cycles.
Maybe.. just maybe.. you’d understand why Satoshi Nakamoto hardcoded a halving every four years. It does make sense, doesn’t it?
Why does all of this people fade miners aswell?...
This doesn’t mean Bitcoin will follow the exact same 4-year pattern forever, but right now from a technical + macro + liquidity perspective, it does seem to repeat the cycle top behaviour.
But we might see a different bull market cycle from now on, especially now that the Fed is starting to reshape its balance sheet toward shorter-duration assets.
That’s why my roadmap from here points to a new ATH well before the next halving.
I wrote about this in my article from late November.
You can read it here 👉 gmartind.substack.com/p/bitc…
That said, Bitcoin is still a young and speculative asset, especially when considering it as a safe haven. I strongly believe it has all the characteristics needed to become digital gold, but it still needs time.
This is why another key driver of Bitcoin’s price has always been strong narratives that form during each bull market.
When the liquidity cycle reaches its peak, those bullish narratives lose their effectiveness.
So far, everything I’ve been warning about since October has played out. At this stage, Bitcoin appears to have set a local top during this relief rally, which I’ve been talking about since November.
I still see a small chance of a push back toward 100k, and I believe that would trigger peak FOMO, likely followed by a much more violent selloff, similar to what we saw in November.
Altho, for now, Bitcoin’s price action doesn’t look very bullish. Part of this may be explained by the chaos generated by Trump and the historic structural changes in global trade that are unfolding.
This also helps explain the secular move we’re seeing in #Gold and #Silver.

$BTC:
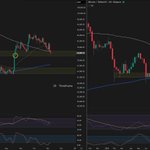
You can see how this price range has made the difference so many times in the past.
It either gets tested and holds, or once it breaks, price moves violently.
That’s why I’ve been mentioning it so much this past week.
I would have preferred to see BTC just fall sharply into $73K over a few weeks...
But this slow chop to the downside, with downward momentum building, is simply not the best looking setup.
So far, BTC tested this zone and is now attempting to close the Week back above the September lows.
I’ll take it as a positive sign if it closes between $75K–$76K.
Either way, I’m still not a huge “fan” of the Weekly chart, despite BTC attempting to close above $75K and the 50-Week SMA.
If this KEY zone is going to hold...
I want to see a bottom forming on lower timeframes before I can confidently say this was the bottom and start buying back.

#Bitcoin:
Very ugly looking Weekly candle right now.
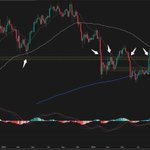
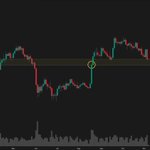
BTC price has currently tested the FVG demand zone I've been pointing at.. the 73k imbalance that made the higher high possible.
Futures market open soon, and we want to see a bounce from here now in order to reclaim 75k before the Weekly close.
Otherwise, this all points at downward momentum/continuation, and the next support comes around 66k - 69k, right at the 200 Week SMA.

#Bitcoin:
Very ugly looking Weekly candle right now.
BTC price has currently tested the FVG demand zone I've been pointing at.. the 73k imbalance that made the higher high possible.
Futures market open soon, and we want to see a bounce from here now in order to reclaim 75k before the Weekly close.
Otherwise, this all points at downward momentum/continuation, and the next support comes around 66k - 69k, right at the 200 Week SMA.


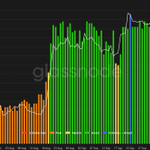
$BTC: Fear & Greed index described in the quoted post.

I know... there are too many indicators on this chart.
But these are all the things I’m looking at right now during this phase of the #Bitcoin cycle.
Yesterday, $BTC slightly “deviated” below the September lows and closed back inside the range.
I wouldn’t call it a proper sweep of the lows, but technically speaking, it was.
The reason I’m showing all these indicators is because despite all the fear and uncertainty, BTC is somehow still holding the key 75K support...
And it’s doing so while a lot of things are pointing to us being very close to an inflection point that, in my view, should resolve to the upside.
Bitcoin is starting to test key moving averages as support. Each test is coming with increasing volume.
Daily MACD keeps diverging from price, unable to break lower and hold.
RSI is near oversold levels and also diverging from price.
Stochastic is getting squeezed at oversold.
Out of all these indicators, the one I’m watching the most is Stochastic.
Being the fastest momentum indicator, if Bitcoin keeps holding 75K and we finally see Stoch break above the 50 level, I’ll take that as a first signal.
ALL of this is happening while the BTC Fear & Greed Index is at levels last seen in August...
And if we get a proper sweep of the lows, then sentiment could hit extreme fear, levels last seen around the June/July bottom.
In this case, we want to see breakdown and quick reclaim of 75k !..
Now, as you know, there is one thing I’m not liking right now:
The Weekly candle.
Ideally, I want to see it close with AT LEAST a small wick. Even better if it can close above 76k.
Otherwise, it would point toward continuation lower, and the next VERY KEY zone to hold is 73K.
That’s the zone where we would want to see a deviation followed by a quick reclaim of 75K.
If not, we would be at risk of a sharper sell-off into the 200 Week SMA.

I know... there are too many indicators on this chart.
But these are all the things I’m looking at right now during this phase of the #Bitcoin cycle.
Yesterday, $BTC slightly “deviated” below the September lows and closed back inside the range.
I wouldn’t call it a proper sweep of the lows, but technically speaking, it was.
The reason I’m showing all these indicators is because despite all the fear and uncertainty, BTC is somehow still holding the key 75K support...
And it’s doing so while a lot of things are pointing to us being very close to an inflection point that, in my view, should resolve to the upside.
Bitcoin is starting to test key moving averages as support. Each test is coming with increasing volume.
Daily MACD keeps diverging from price, unable to break lower and hold.
RSI is near oversold levels and also diverging from price.
Stochastic is getting squeezed at oversold.
Out of all these indicators, the one I’m watching the most is Stochastic.
Being the fastest momentum indicator, if Bitcoin keeps holding 75K and we finally see Stoch break above the 50 level, I’ll take that as a first signal.
ALL of this is happening while the BTC Fear & Greed Index is at levels last seen in August...
And if we get a proper sweep of the lows, then sentiment could hit extreme fear, levels last seen around the June/July bottom.
In this case, we want to see breakdown and quick reclaim of 75k !..
Now, as you know, there is one thing I’m not liking right now:
The Weekly candle.
Ideally, I want to see it close with AT LEAST a small wick. Even better if it can close above 76k.
Otherwise, it would point toward continuation lower, and the next VERY KEY zone to hold is 73K.
That’s the zone where we would want to see a deviation followed by a quick reclaim of 75K.
If not, we would be at risk of a sharper sell-off into the 200 Week SMA.
This is what I mean when I mention #Bitcoin Weekly close.
A LOT of confluence for $73k-$75k to hold.
Momentum at a key inflection point while $BTC keeps testing this support level.
Indicators lag, so they will turn after price pumps.
But if Stochastic RSI (the fastest), can reach oversold while price remains unable to break lower, then I'll take it as a strength signal.
MACD Histogram can get red, that's fine, as long as the moving averages dont cross below 0.

This is what I mean when I mention #Bitcoin Weekly close.
A LOT of confluence for $73k-$75k to hold.
Momentum at a key inflection point while $BTC keeps testing this support level.
Indicators lag, so they will turn after price pumps.
But if Stochastic RSI (the fastest), can reach oversold while price remains unable to break lower, then I'll take it as a strength signal.
MACD Histogram can get red, that's fine, as long as the moving averages dont cross below 0.
Since I mentioned the #Bitcoin 2023 chop period before the parabolic run, I went back to look at that range.
I remember thinking the $23K–$25K support looked extremely fragile, and that breaking it could trigger a big pullback toward $20K or lower.
But most HTF momentum indicators were slowly pointing toward an uptrend. If $23K–$25K held and LTF momentum started shifting higher, then Bitcoin could finally transition into a bull market.
This current range reminds me a lot of that period.
The main difference is that back then, almost every asset was coming out of a prolonged bear market. Even with the Fed still hiking rates, everything was slowly starting to look bullish.
This time is different.
$BTC seems to be coming out of a bear market while stocks kept trending higher, mostly driven by AI stocks that absorbed a huge amount of liquidity.
And now, with the possibility of higher rates again, we are seeing a major unwind of that euphoria/bubble.
But Bitcoin has been taking it on the chin like a champ despite all the fear around a stock market crash.
Now, I don’t know if contagion from equities will eventually make BTC lose the $73K–$75K support.
A lot of people say Bitcoin is lagging and will eventually catch up to the downside...
But in my experience trading Bitcoin, it’s usually the opposite.
I’m taking this phase step by step.
In my view, this is the “disbelief” part of the Bitcoin cycle.
The transition from bear to bull market usually comes with a lot of anxiety and fear, since we just came out of a period with huge drops in a matter of days.
So if $73K–$75K keeps holding, even with a quick deviation below $75K followed by a fast reclaim..while HTF momentum keeps improving, then I would become much more confident that the next leg higher could be parabolic.
If not, then I’ll be looking toward the $66K–$69K range.
And we DEFINITELY don’t want to see $66K break.
So what’s my next step?
My buying average is simply not as good as I would like, so I already closed part of my position.
I rather raise cash and wait for a more confirmed setup, even if that means buying back slightly higher.
Ideally, I want to see a better looking Weekly candle close first.
Otherwise, I’ll probably sell the rest of my spot position.
Right now, the Weekly candle is giving me bearish vibes and Weekly momentum indicators are right on the verge of turning bearish.
But this is ALL happening at a huge level with many key moving averages confluence pointing at this range as very strong support.
Indicators tend to lag, so everything will depend on whether $73K–$75K can hold while HTF momentum starts improving again.
On the Daily chart, we are reaching oversold conditions while momentum indicators keep diverging from price as BTC continues making shallow lower lows.
Volume is increasing at support while sentiment is close to extreme fear.
Final note:
How you manage this phase of the Bitcoin cycle depends entirely on your risk tolerance, your potential drawdown, and how much capital you have allocated to BTC.
Personally, I trade for a living, so my number one rule is capital preservation.
I’d rather sacrifice some potential profit than keep a large portion of my capital in a trade that starts to feels uncertain. I think this is normal is "disbelief" phases in Bitcoin cycles.
But like I said before...
If my buying average were better, my reasoning would be completely different.

Since I mentioned the #Bitcoin 2023 chop period before the parabolic run, I went back to look at that range.
I remember thinking the $23K–$25K support looked extremely fragile, and that breaking it could trigger a big pullback toward $20K or lower.
But most HTF momentum indicators were slowly pointing toward an uptrend. If $23K–$25K held and LTF momentum started shifting higher, then Bitcoin could finally transition into a bull market.
This current range reminds me a lot of that period.
The main difference is that back then, almost every asset was coming out of a prolonged bear market. Even with the Fed still hiking rates, everything was slowly starting to look bullish.
This time is different.
$BTC seems to be coming out of a bear market while stocks kept trending higher, mostly driven by AI stocks that absorbed a huge amount of liquidity.
And now, with the possibility of higher rates again, we are seeing a major unwind of that euphoria/bubble.
But Bitcoin has been taking it on the chin like a champ despite all the fear around a stock market crash.
Now, I don’t know if contagion from equities will eventually make BTC lose the $73K–$75K support.
A lot of people say Bitcoin is lagging and will eventually catch up to the downside...
But in my experience trading Bitcoin, it’s usually the opposite.
I’m taking this phase step by step.
In my view, this is the “disbelief” part of the Bitcoin cycle.
The transition from bear to bull market usually comes with a lot of anxiety and fear, since we just came out of a period with huge drops in a matter of days.
So if $73K–$75K keeps holding, even with a quick deviation below $75K followed by a fast reclaim..while HTF momentum keeps improving, then I would become much more confident that the next leg higher could be parabolic.
If not, then I’ll be looking toward the $66K–$69K range.
And we DEFINITELY don’t want to see $66K break.
So what’s my next step?
My buying average is simply not as good as I would like, so I already closed part of my position.
I rather raise cash and wait for a more confirmed setup, even if that means buying back slightly higher.
Ideally, I want to see a better looking Weekly candle close first.
Otherwise, I’ll probably sell the rest of my spot position.
Right now, the Weekly candle is giving me bearish vibes and Weekly momentum indicators are right on the verge of turning bearish.
But this is ALL happening at a huge level with many key moving averages confluence pointing at this range as very strong support.
Indicators tend to lag, so everything will depend on whether $73K–$75K can hold while HTF momentum starts improving again.
On the Daily chart, we are reaching oversold conditions while momentum indicators keep diverging from price as BTC continues making shallow lower lows.
Volume is increasing at support while sentiment is close to extreme fear.
Final note:
How you manage this phase of the Bitcoin cycle depends entirely on your risk tolerance, your potential drawdown, and how much capital you have allocated to BTC.
Personally, I trade for a living, so my number one rule is capital preservation.
I’d rather sacrifice some potential profit than keep a large portion of my capital in a trade that starts to feels uncertain. I think this is normal is "disbelief" phases in Bitcoin cycles.
But like I said before...
If my buying average were better, my reasoning would be completely different.
$BTC hardest support I've traded in a long time.. probably since 2023 chop previous to the parabolic run to ATH.
The daily chart keeps printing lower lows with high volume, unable to break $75k while momentum indicators keep diverging from price.
If we can get a nice bounce on this and a solid Weekly close, I am buying back.

$BTC hardest support I've traded in a long time.. probably since 2023 chop previous to the parabolic run to ATH.
The daily chart keeps printing lower lows with high volume, unable to break $75k while momentum indicators keep diverging from price.
If we can get a nice bounce on this and a solid Weekly close, I am buying back.
$BTC:
We need to see a bounce asap before 3-Day candle close.. the sell-off after yesterdays relief rally makes the whole structure look very weak.
What worries me the most is the Weekly chart. Momentum is starting to shift into a bearish setup right at a KEY support.. and if it closes like this, there is a huge gap to get filled until 67k-69k range.
Considering that Bitcoin price is currently at my whole buying average, I am thinking on selling in order to get cash ready.
In any case, if BTC bounces now and the Weekly candle has a better closing, I rather buy back a bit higher than missing out on buying lower.

$BTC:
We need to see a bounce asap before 3-Day candle close.. the sell-off after yesterdays relief rally makes the whole structure look very weak.
What worries me the most is the Weekly chart. Momentum is starting to shift into a bearish setup right at a KEY support.. and if it closes like this, there is a huge gap to get filled until 67k-69k range.
Considering that Bitcoin price is currently at my whole buying average, I am thinking on selling in order to get cash ready.
In any case, if BTC bounces now and the Weekly candle has a better closing, I rather buy back a bit higher than missing out on buying lower.
Despite #Bitcoin still holding $75k support while we are seeing major AI trade unwind..
I would really like to see some bounce here before the 3-Day candle close and most importantly, I don't want to see a Weekly close this ugly.
Price is at my buying average, and I might have to close part of my position and get more cash available.
Really brutal PA.

Despite #Bitcoin still holding $75k support while we are seeing major AI trade unwind..
I would really like to see some bounce here before the 3-Day candle close and most importantly, I don't want to see a Weekly close this ugly.
Price is at my buying average, and I might have to close part of my position and get more cash available.
Really brutal PA.
AI stocks are getting crushed.
I was told that #Bitcoin would flush down to 50K when the AI bubble started to unwind.
I don't know...
$ETH:
The reaction from $2200 is not random.
Now we want to see a bottom forming, a higher low and mometum building up.
#Ethereum
#Ethereum:
Once again, Ethereum is consolidating around the middle of its entire 5-year range.
And right now, price is sitting ABOVE it.
We’ve seen this structure before:
Break above the range → deviate higher → come back and test it as support.
These retracements tend to be around -20% on average.
I still have another order waiting at $2,200 in case $ETH drops a bit deeper.
But since I remain bullish on $BTC and expect a rally.
I also expect Ethereum to eventually make a move toward at least $3,200.

G.Martín retweeted
“#Bitcoin will sell-off after the midterms”
But what if this entire narrative is just another coincidence that bears are using to justify waiting for a lower entry?
Think about it.
If we agree that $BTC cycles have been slowly shifting to the LEFT (becoming faster), then the last three post-election bottoms don’t exactly show a consistent timing pattern:
2014 → bottomed 70 days after the elections.
2018 → 35 days after.
2022 → price started dropping EXACTLY on the midterms date.
The “post-midterms sell-off” keeps happening EARLIER.
I don’t know about you...
But to me, this sounds like another narrative people are using to make sense of price action.

#GOLD just touched the KEY level I’ve been watching while “max bearishness” sentiment was reaching extreme highs.
The $3,800–$3,850 area was the main support to hold, sitting almost exactly at the 0.382 secular Fib level.
Lose that zone, and a deeper correction could come into play.
But as usual...
Everyone was waiting for $3,500.
And ironically, that consensus was one of the signals that made me more confident about $3,800–$3,850 holding first.
So far.. the reaction has been very solid.
And at least for now, that support looks very likely to hold.
#GOLD update
We are finally starting to see a reaction from this key support.
Exactly where I was talking about “max bearishness” in the quoted post.
That post is mostly about herd psychology and how narratives tend to become strongest near extremes, so give it a read if you like that type of analysis.
On the first chart, the reaction from $4,000 looks good so far.
Still not out of the woods...
But with the Monthly close approaching, I think seeing a proper wick/rejection from this zone would be important.
Daily RSI is approaching oversold, while MACD is showing a pretty clear divergence.
That gives us some confluence for a bigger bounce.
Still, I’m not ruling out one final sweep of the lows toward $3,850.
Now look at the second chart.
The similarities between this secular Gold trend and the previous one are VERY interesting.
The previous secular trend started from the late ’90s bottom.
Roughly 10 years later, Gold went through a major pullback during the 2008 GFC...
Then continued trending higher for another three years into 2011.
The current secular trend started from the early 2016 bottom.
And now, in 2026, we are once again trying to form a bottom roughly 10 years later.
But there’s another interesting confluence:
In both cases, the retracement reached roughly the 0.382 Fibonacci level, an important level for trend continuation.
Right now, that level sits around $3,800.
And interestingly, it also lines up with the Monthly FVG zone visible on the first chart.
I keep seeing people calling for Gold to fall toward $3,200–$3,500.
Could it happen?.. Sure.
That would take price toward the 50-Month EMA and around the 0.50 Fib level.
It would STILL fit within the broader bullish trend.
But I don’t really see the logic in refusing to start buying here just because price could potentially fall another ~10%...
When the upside over the next several years could be MUCH larger.
For now, my position remains physical Gold.
The opportunity for a more “precise,” strongly leveraged position will come later.


Yesterday after #Bitcoin bounced hard, so many people unfollowed me 😅..
I have been very open and transparent with my positioning, even after the Binance hack and all the FUD around it, I've been pointing at trend structure and price being close to a bottom.
I don't understand this people.. Maybe unhappy bears?
Scary times to be buying #Bitcoin...
The last thing you want to see is the biggest crypto exchange getting hacked.
But I still got my $77.5K and $76.5K orders filled.
I’m now 75% allocated, with a $76.2K buying average.
My remaining liquidity is sitting below the September lows, between $72K–$74K, so I can improve my average if the panic selling continues.
Looks like this is the range we’ll be consolidating in until the next leg higher.
The thesis hasn’t changed.
$BTC being a hedge against monetary inflation does NOT suddenly change because Binance got hacked.
Times like this are probably better spent logged off from social media.
There’s a lot of fear and uncertainty right now...
Yet Bitcoin remains in an HTF bullish structure, sitting at strong support, approaching oversold conditions with sentiment deep in fear.
Sounds like a pretty good recipe for a bottom...
Or at least getting very close to one.


$BTC:
Very strong reaction at a KEY level from oversold conditions on LTF and almost extreme fear sentiment
#Bitcoin
#Bitcoin 2023 - 2026
20/21-Week MAs and 200-Day SMA tested as support.
RSI at oversold levels.
Sentiment close to extreme fear.
We need a deviation of the lows, and the setup will look almost identical to 2023.
I don’t think we’ll see the same type of quick rally, though...
The market will probably need some time to digest the Binance hack “black swan”
I am basically showing the fractal as an example of the trend structure and price reaction to an important support level.

A note to my future self.. and maybe this helps you too.
When something in your body hurts, what’s usually the WORST thing you can do?
Google it...
Five minutes later, you’ve gone from a stomach ache to convincing yourself you have cancer.
Then you visit an actual doctor and realize there was probably nothing to panic about.
Markets work exactly the same way.
You can have a clear technical thesis...
Then price suddenly drops.
You open X.
And within minutes, the algorithm feeds you an endless stream of doom, panic, conspiracies and emotional garbage from random people who are just as scared as everyone else.
After creating content here for about a year, one thing became VERY clear to me:
Most of what you consume during moments of volatility is junk food for your brain.
And this works BOTH ways.
When price crashes:
Bears celebrate.
Sidelined traders call for much lower prices.
Short traders become louder.
Everyone suddenly “knew it”
When price rips higher:
PnL screenshots everywhere.
Lambos.
Euphoria.
“HIGHER!”
Same emotional cycle.
So if you already have a thesis, a plan and clear invalidation levels...
Sometimes the best thing you can do during extreme volatility is simply NOT open this app.
Up or down... Fear or greed.
Protect your brain from the feed.
Now that Iran has achieved what I believe was its main objective, hurting Trump and the Republicans politically, Trump’s threats of dropping nuclear bombs on Iran clearly didn't work.
As usual, its only to induce fear, panic...
The chances of a “deal” are higher now, and I think that’s one of the reasons we’ve been seeing Oil sell off so aggressively into the midterms.

In my experience, what looks like the most obvious scenario to everyone, never ends up happening.
Tbh I think its impossible for normal people to know whats brewing behind with all this.. thats why I always try to focus on price action to guide me where it wants to go next.
But if I have to speculate with this whole thing..
How many times did Trump say X but did Y?
Oil is down -10% in 2 days with probably fake news about a deal (again), but seems like a strong reaction previous to midterms..
In my view, Iran goal is to make Trump lose the midterms.
I think if Republicans lose, the first reaction on the markets could be negative because thats how markets react when right wing parties lose.. but after that if we see oil prices going even lower then you know Trump isn't doing shit against Iran.