

Reading options dealer positioning daily. Husband and father of two young boys and a 12-year-old Corgi named Henry.
California
Joined December 2025
- Tweets2.8K
- Following46
- Followers1.3K
- Likes597





Pinned Tweet
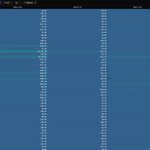
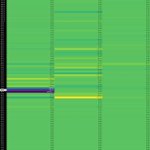
GEX = Gamma Exposure — dealer hedging sensitivity to price movement.
VEX = Vanna Exposure — dealer hedging sensitivity to volatility (specifically, how delta shifts when IV changes).
Most traders watch price. I watch who's forced to trade against it.
Every options contract sitting open creates a hedging obligation for market makers. Not a prediction — an obligation. When they're long gamma at a strike, they sell rallies and buy dips to stay neutral. Price gets sticky. When they're short gamma, they do the opposite: buy strength, sell weakness. Price accelerates.
That's why some levels act like magnets and others act like trapdoors.
Three things I look at:
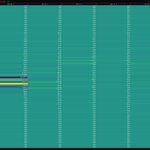
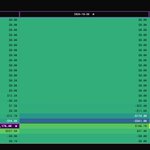
The King Node — the strike with the largest dealer exposure. Yellow means it pins. Purple means it amplifies.
What sits above vs below spot — a big positive node overhead is resistance you fade into. A big negative node underneath is a level that breaks fast once tapped.
What's growing or shrinking — a node gaining size means hedging pressure is building there. One that's fading has already done its work.
The part most people miss: purple cuts both ways. Short gamma doesn't mean bearish. It means whatever happens, happens faster.
This isn't a crystal ball. It's a map of where mechanical flow lives. Price still does what it wants — this just tells you where the friction is.
Not financial advice. Educational only. I'm not a registered advisor and nothing here is a recommendation to buy or sell anything.

$AAOI $66.93 −15.5%
AAOI got hit hard today and is now sitting right on its biggest level, the $65–67 zone. That’s where most of today’s options are stacked, so it acts like a magnet. Above, nothing strong shows up until $70. The levels near $75 and $80 could speed things up if buyers ever push it that high. BUT WE NEED BUYERS GOD DARN IT.
Most likely: chops between $65 and $68 into the close.
Wrong if: it closes under $65.
Watch: $65, $67, $70, $75
CSP: No clean setup
Covered call: No clean setup

Hey guys with stocks like $intc down 30 percent. It feels like we are looking into the abyss. I don't have a big account but the few of you guys that do follow me i see you as family. Please DM ME if you are struggling and need someone to talk to esp about stocks. Or just DM to bitch about the stocks you own. I'm here.
This is a great question to the AI based 0DTE trades we are doing on the challenge account. The answer is WE DONT. Ai reccomended we dont take any directional 0DTE trades after 12 eastern time. Only credit spread calls or puts and only if the premiums r good. $spy $qqq $spx

Directional Ai gamma based 0dte trades are done for today. Here is the screenshot. Once i run this long enough where i feel we have advantage I will start streaming the ai prompts LIVE for you guys during trading hours so you guys can follow along second by second.
Challenge account was created 1 week ago with 1k funded. The account is now officially sitting at 2118.00 up 116 percent this week. Lets see if we can continue this next week. First screenshot is today trades the 2nd screenshot is total trades. (You see that 198 dollar loss ? That was me trading on my own LOL ☺️) $spy $spx $qqq $nbis $CIFR $gme


Update to last nights post.
I have been testing this setup internally for about 1 week using a cash challenge account funded by 1k. Currently the account is sitting at approx 1653.00 dollars.
My goal is to test it till i feel comfortable enough that its giving us an advantage. 1 week is to short of a time but I'm going to run this through November but i wanted give you guys an update of where we are and how much the account is worth. I have saved all the trades for the past week and i will post them at the end of the day Friday including todays trades.
Can 3 gamma heatmaps + Chart + All analyzed by AI give us an advantage? Lets see!
IF i feel that it will be beneficial THEN i will stream the AI for everyone so you get second by second update during trading hours. Wish us luck! I will post the trades today Winner or Loser. We need accountability. $spy $spx $qqq $nbis $CIFR $gme
🚨Okay the Gamma run AI trade UPDATE for today. $spy $qqq $spx $xsp
1st trade - PROFIT 393 dollars 3 Put contracts
We received our buy signal from the programmed AI utilizing 3 different gamma software's plus trading view chart with 5 indicators. AI is monitoring all of these and updating me ever 2 minutes automatically without any prompts from me on any 0dte index trades.
This morning we received our first buy signal (posted below)
I bought 2 put contracts on the XSP although initially negative the tilt down floor was growing so i added a 3rd contract. For total of 3.
AI posted the following - As you can see it told me WHEN to buy at WHAT price and WHEN to sell.
BUY NOW: XSP 762 PUT at SPX 7624. Take most at 7600, the rest at 7590/7575. Stop SPX 7642. Time stop 10:20 ET. 60%.
All three now point down:
TerraShade: fast got much stronger (−$68B, from −$47B). King and put wall at 7600, right below. The call wall moved up to 7700. Range 7567–7683.
Quant Data: fast 7600 (−5.9B) is now its King, below price.
Skylit: the biggest level is fast 7590 (−$49M), 1.4x the fast 7680 above. SPX is slipping off the calm 7625 floor (+$24M). Under that, fast 7600/7590 can speed it up toward calm 7575.
Update to last nights post.
I have been testing this setup internally for about 1 week using a cash challenge account funded by 1k. Currently the account is sitting at approx 1653.00 dollars.
My goal is to test it till i feel comfortable enough that its giving us an advantage. 1 week is to short of a time but I'm going to run this through November but i wanted give you guys an update of where we are and how much the account is worth. I have saved all the trades for the past week and i will post them at the end of the day Friday including todays trades.
Can 3 gamma heatmaps + Chart + All analyzed by AI give us an advantage? Lets see!
IF i feel that it will be beneficial THEN i will stream the AI for everyone so you get second by second update during trading hours. Wish us luck! I will post the trades today Winner or Loser. We need accountability. $spy $spx $qqq $nbis $CIFR $gme
Hey everyone iv been busy working on something for us and testing to see if it can work. Ill have more details tomorrow.
1. Basically i have been programing claude ai with data backed research using AI own research on 0DTE index trading ($spy $qqq $spx) for example if gamma heatmaps can predict direction in conjunction with supporter levels via charts etc. Asking it to give a probability when a trade success reaches above 60 percent.
2. I have then used claude bot to open and read the 3 gamma heatmap software's simultaneously
(yes i use 3 lol) . I have also given it access to my trading view account with all the indicators set up.
3. I have then instructed and programed it to read all gamma heatmaps for SPY QQQ and SPX. See where the fast moving levels are and calm levels. Use charts via trading view to map out direction and support level indicators. Then have AI give a probability on a trade above 60 percent.
4. We then use 1 thousand dollar challenge account to see if we can create daily income by risking very low amounts usually 1 or 2 contracts hoping to make about 200 dollars per day.
5. The idea is to create low risk low capital requirement trade that can be used to create a monthly income like a job.
More update tommorrow. $nbis $apld $CIFR $gme $sofi
Nasdaq is down over 2.5 percent tonight. Unless some big turnaround happens in the market tomorrow, a lot of people are going to lose a lot of money. I pray it doesn't happen and we see a big reversal in the morning. Anything is possible. This is, however, why I have not been posting much. I refuse to participate in an environment where something I post—whether it comes from me, a heatmap, or a chart—causes someone to buy something (for example, $INTC) and have it crash. Why? Because honestly, before today, $INTC did not look bad either on the charts or the gamma heatmaps.
My sole goal starting this account was to provide usable, potentially actionable information to give maybe just a bit of an advantage to a regular folk like me. I have always gone into this with the mindset of capital preservation. If my account is down big, okay fine, but maybe I can save someone else. But a lot of fintech bros on here are charging regular folks $200 or more to lose all their money for them. Like, how can you sleep at night? Wouldn't the right thing to do, at least for a few months, be to say, "Hey everyone, I'm refunding everyone's money for the next month. Markets will go back up, but for now I don't need to add a $200 fee on top of your losses"?
The truth is, it's not anybody's fault why the market is like what it is today. No one here started the Middle East conflict, or made $GOOGL miss their earnings, or caused $RDDT to lose their traffic.
But let me ask you a question. If you are day trading with less than $25k because they removed the PDT rule, should you really be? At that point, is it still someone else's fault you lost your money? There was a reason why the PDT rule existed in the first place.
Leveraging your account by upwards of 60 percent or more? Using your life savings? Treating Kalshi like a fortune teller and giving it access to your bank account?
Letting people on X who you don't know from a hole in the ground convince you that Hyperliquid is the next place to trade your life savings away—because 5 days a week is not enough, now you need to do it 7 days a week?
We are adults. At the end of the day, we make our own decisions. When things go down, we have no one to blame but ourselves. No one will come to our rescue. Especially if you are a provider for your family. Whatever you do, leave yourself a parachute. A way to come back when you are down.
Edited to add (Before anyone thinks I'm giving a lecture. I HAVE PERSONALLY made all these mistakes my self and more. My hope is someone learns from my mistakes)
$qqq down almost 3 percent in 24 hour period.
Sorry guys days like today are the reasons why i havent been updating much. This price action and pump and dump can easily catch people in bad trades and i dont want to contribute to anyones losses in this type of price action. At least till the election. Its to risky to enter heavy posotions.
Unless you think this is the bottom and you dont mind some additional loses. Getting into $sofi in the 16s $apld under 20 iren around 25 if you think these are generational prices and you are holding long term then advantage.
$SMCI $35.39 (−1.2%)
SMCI is sitting just above its biggest calm level at $35, which is by far the strongest thing on the map, so price should stay stuck near it. More calm support sits at $34.50 and $34. Right above, $36.50–37 acts as a calm ceiling, so a push up should stall there. Next week the calm levels move up to $40–41, but they’re small for now.
Watch: $34.50, $35, $37, $40
Most likely: stays between $35 and $37 into Friday.
Wrong if: closes above $37.
CSP: No clean setup. The Nov 13 options date is nearly empty, and the biggest level under price there is a fast one at $34.
Covered call: No clean setup. The Nov 13 date has no real floor under price.

$GOOGL $286.29 (−11.9%)
Lean: Neutral, sideways
Google dropped about 12% after earnings and landed right on its biggest calm level, $285. Dealers there tend to buy dips and sell rips, so price should settle in here, not keep sliding. There’s more calm support at $280 and $275. A big fast zone sits up at $300, but it only matters if a real bounce gets going. The stock is still repricing after earnings, so this map can shift through the day.
Watch: $280, $285, $292.5, $300
Most likely: chops between $285 and $292.5 into Friday.
Wrong if: closes below $280.
CSP: No clean setup. The map doesn’t go out two weeks (the last date is Nov 9), and the stock is still repricing.
Covered call: No clean setup, for the same reasons.
The fast $300 level is almost as big as the $285 King (about 1.2x apart). If GOOGL gets back above $292.5, it could get pulled up there quickly.

All gamma heatmaps before election please take with grain of salt.
$GME $23.88 +2.4%
Lean: Neutral, tilting up
GME has a big calm level at $25, right above the price. It’s the biggest level on the board. Levels like that usually pull the price up to them and then hold it there. They don’t usually launch it higher. $24 to $24.50 should act as support. Below $23 there’s less support, and drops can speed up.
Most likely: Drifts up into $24.50–$25 and stalls there.
Wrong if: It closes below $23.
VEX: $25 is the strongest spot here too. If volatility cools off, dealers buying should help the drift up.
Watch: $25 (magnet and ceiling), $24 (support), $23 (trap door).
CSP: No clean setup. There are fast spots between the price and any put strike.
Covered call: Yes, $25, near-term.
