

A service of @GSU_Library's Research & Data Services Team - promoting #dataliteracy for the public good & preparing students for data-related careers
- Tweets376
- Following259
- Followers160
- Likes120









ALT This graphic shows a scatterplot where the dots a clustered in a way that is forming a positive relationship (as x increases so does y), but there is one outlier about ¾ down the x-axis that has a much smaller y compared to other points with a similar x value. At the bottom of the graphic it says #CaptionTheChart DAY 4 - My Kind of Data #LoveData24
ALT This graphic shows a scatterplot where the dots a clustered in a way that is forming a positive relationship (as x increases so does y), but there is one outlier about ¾ down the x-axis that has a much smaller y compared to other points with a similar x value. At the bottom of the graphic it says #CaptionTheChart DAY 4 - My Kind of Data #LoveData24


ALT This graphic shows a normal or bell-shaped curve. At the bottom of the graphic it says #CaptionTheChart DAY 3 - My Kind of Data #LoveData24
ALT This graphic shows a normal or bell-shaped curve. At the bottom of the graphic it says #CaptionTheChart DAY 3 - My Kind of Data #LoveData24

ALT This graphic shows a bar chart with four bars, the first bar (colored blue) is the tallest), the next bars (a green one, yellow one, and pink one) are all significantly smaller and are gradually decreasing. At the bottom of the graphic it says #CaptionTheChart DAY 2 - My Kind of Data #LoveData24


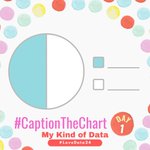
ALT This graphic shows a pie chart that is split in half with the left half being light blue and the right half being white. There is key to the right of the pie chart with a blue square and a horizontal line and white square and a horizontal line inviting you to fill it in with your own caption! At the bottom of the graphic it says #CaptionTheChart DAY 1 - My Kind of Data #LoveData24

ALT This graphic shows a pie chart that is split in half with the left half being light blue and the right half being white. There is key to the right of the pie chart with a blue square and a horizontal line and white square and a horizontal line inviting you to fill it in with your own caption! At the bottom of the graphic it says #CaptionTheChart DAY 1 - My Kind of Data #LoveData24


ALT A flyer with a head shot of Layla Bellows, a Community Data Analystis at Atlanta BeltLine, Inc., she appears to be outside and has long brown hair and is wearing a red blouse. Layla Bellows is the special guest for the next Data in the ATL, titled, The Atlanta BeltLine: Visualizing Inequities & Programming for Improvement this Friday, September 29th at 11 am in CURVE, 2nd floor of library South. The flyer also includes the Georgia State University Library Logo, a QR code for the event info, and a website lib.gsu.edu/data929
ALT A flyer with a head shot of Layla Bellows, a Community Data Analystis at Atlanta BeltLine, Inc., she appears to be outside and has long brown hair and is wearing a red blouse. Layla Bellows is the special guest for the next Data in the ATL, titled, The Atlanta BeltLine: Visualizing Inequities & Programming for Improvement this Friday, September 29th at 11 am in CURVE, 2nd floor of library South. The flyer also includes the Georgia State University Library Logo, a QR code for the event info, and a website lib.gsu.edu/data929
