

Our Nucleus data analytics platform aggregates data from all association sources (AMS, community, email system, LMS, etc.) and delivers insights to all staff.
Alexandria, VA
Joined January 2009
- Tweets2.5K
- Following523
- Followers607
- Likes1.2K






Last day to register: Member #Data Analytics in 2022. Join our speakers Rebecca & Michelle for a 10-minute group demo at 12pm ET.
Rebecca will be sharing real #association examples of member data in Nucleus Analytics.
Register now > hubs.la/Q012VVtj0
#assnchat #assnprofs

NEW 4-Part Executive Brief: Association #Analytics for Association Leadership 2022 - an overview for #association executives.
Get free key insights & checklists >> hubs.la/Q012K-Zm0
#assnchat #assnprofs #data

Live webinar at 11am ET today. Join Association Laboratory for Looking Forward 2022 for 1.5 #CAE credits. The latest research that covers factors affecting the #association environment in 6 domains.
Register here >> hubs.la/Q012srcW0
#assnchat #assnprofs
Dr. Martin Luther King Jr. showed us the tenderness of equality and the power one dream can have. His cause was bigger than himself or any individual. Yet today, we take the time to acknowledge his undying passion for his fellow man. #hope #equality #ihaveadream #mlkday

ALT Martin Luther King Jr. Day
One week from today - a fascinating "day in the life" sneak peek of what's just ahead for association professionals using data analytics.
Join us for role-specific previews of the near future (in just 30 minutes):
hubs.la/Q010NMk60 @CommunityBrands @FSAE @MidAtlanticSAE
We're getting a lot of questions about #data at this year's @DigitalNow conference around the importance of becoming a data driven #association. Here are a few helpful tips that we have given to #assnprofs during the event so far >> hubs.la/Q010zWYZ0

Tomorrow - Analytics for Association Event Professionals
See how first-year use of data analytics:
- Increased Annual Conference attendance by 30%
- Reduced Conference planning time by 75%
- Registration campaigns enjoyed a 700% ROI
hubs.la/H0_KnNY0 @FSAE @tsae
Start your day with a coffee and a look at your data dashboard - anyone who can browse the web can use Nucleus to see what's going on with membership, events, learning/certification, fundraising - whatever your association role is.
See it for yourself: hubs.ly/H0_5myF0

Friday Data Visualization - the world map we're accustomed to is based on a 1569 method that works well for navigation but skews the sizes of land masses - larger at the poles, smaller at the equator. See actual sizes here: hubs.la/H0_5dy80 @vsae @tsae @CalSAE @assnsnorth

Friday Data Visualization - based on a survey of over 70K people, a fascinating look at how personality type is reflected in average incomes.
@kikilitalien @CESSEorg @EmpireStateSAE @FSAE @ASAEresearch
hubs.li/H0ZqWYW0

Friday Data Visualization - special 1925 edition! Something rare, a 96-year-old data visualization showing indicators of economic growth in the US from 1900-1925, click here: hubs.li/H0Z1Zhw0
@NetForumCB @nysaenet @NewEnglandSAE @CESSEorg

Friday Data Visualization - per a new survey, both B2C and B2B marketers are drawing on more sources of data than ever - we believe the need to bring it all together in a single (Nucleus) data repository to analyze continues to increase!
hubs.li/H0X_VQj0 @FSAE @tsae
Friday Data Visualization - fastest growing jobs!
A comedian once said "Adults don't ask children what they want to do when they grow up to make conversation, we do it because we're looking for good ideas" Well, here's another source! hubs.li/H0XyqPm0 @assnchat @FSAE
"Visualization gives you answers to questions you didn’t know you had."
- Dr. Ben Schneiderman, Founding Director of the University of Maryland Human-Computer Interaction Lab @Comm_Brands @rshonerd @assnsnorth @tsae

Data VIsualizations Wel Love - Earth's Atmosphere edition! See the 5 layers of the atmosphere at scale and marvel at the habitable layer - so thin that several mountain ranges extend beyond it:hubs.li/H0X2jYw0 @kikilitalien @DeirdreReid @FSAE

Data Visualization: a new study by Frontiers in Sustainable Cities shows that 25 cities produce 52% of the planet's urban greenhouse gas emissions.
23 of the 25 are in China, with the other two being Tokyo and Moscow.
Details here: hubs.li/H0WNyjp0 @kanter @agnewfarms

Friday Data Visualization - a fascinating look at the total composition of all life on Earth as measured by biomass. Humans make up approximately .01% of all biomass on this planet - take a quick look at what else is going on!
hubs.li/H0W6qS90
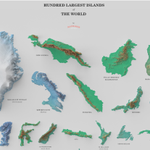
Friday Data Visualization: we'll confess that we didn't know that Great Britain falls between the Canadian islands of Victoria and Ellesmere in terms of size - discover more here: hubs.li/H0VFM3q0

TUESDAY: innovation in ways associations are using analytics to both reveal and share insights into member and other survey data - register here: hubs.li/H0VFVGY0
@assnchat @FSAE @EmpireStateSAE @Comm_Brands
