
Owner and founder of Hobbs Design Group. Passionate about improving the presentation and use of data in the school business office.
Dublin, CA
Joined December 2019
- Tweets5
- Following0
- Followers5
- Likes0
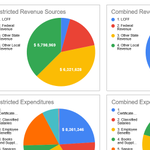
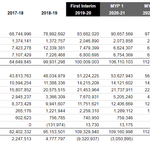

Hi All! I wanted to remind you that we have an amazing tool to help with your second interim report. Upload your SACS file and get a Google Sheet with a Form 01 replica (with graphs!) that you can use for reporting. Free! ow.ly/dYJY50ysFC2

New tool! Upload your SACS .dat file and get back a custom Google Sheet with pre-built graphics and data tables you can copy and paste into presentations, manipulate to perform what-if calcs, or use to double-check your work. Free here: ow.ly/Y75E50xyU2u
Looking to up your data visualization game? Are you into Sparklines yet? Take a look at my latest blog post for examples of how these word-sized graphs can greatly enhance your tabular presentations and your narratives. More here: blog.hobbsdg.com/2019/12/mak…

Google's recent addition of Slicers really spices up your dashboards. And they work great with read-only Sheets. Learn how to use them here: benlcollins.com/spreadsheets…

Looking forward to applying what I've learned in my IT career, fiscal services experience, MBA, and CBO Training to solve real-world problems in school business offices across California. Check out hobbsdg.com?platform=hootsui… for more info on what we do and how we do it.
