Research on #InclusiveEducation. We're @GERONursing's Supporting Progressive Inclusive Child-centred Education (SPICE) lab @UBCNursing / E: [email protected]
Vancouver, British Columbia, Canada
Joined May 2016
- Tweets936
- Following381
- Followers753
- Likes509
UBC Inclusive Education Lab retweeted
NEW #OpenAccess PAPER:📢
Jennifer Baumbusch (@geronursing), Jennifer E.V. Lloyd (@JEVLloyd) & Vanessa C. Fong
Explores K-12 educational journeys & post-secondary transitions of 4,282 BC students w/ #Autism Spectrum Disorder.
Link: journals.sagepub.com/doi/10.…
#UBC #bced #bcpoli

ALT Population-level gender-based analysis of the educational journeys of students with autism spectrum disorder in British Columbia, Canada by Jennifer Baumbusch https://orcid.org/0000-0003-3915-6881 [email protected], Jennifer EV Lloyd https://orcid.org/0000-0002-3173-3659, and Vanessa C Fong https://journals.sagepub.com/doi/10.1177/13623613251345532
UBC Inclusive Education Lab retweeted
This investigation is much needed. When the Ombudsperson investigated complaints in the Seniors Care sector it led to the creation of the BC Seniors Advocate. We need at least the equivalent for the BC K-12 education system (along with adequate funding).
B.C. ombudsperson investigates student exclusion due to disabilities, unruly behaviour vancouversun.com/news/bc-omb…
UBC Inclusive Education Lab retweeted
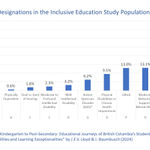
On May 27th, we released a new public report, exploring the Kindergarten-to-Post Secondary journeys of *68,000* BC students with #InclusiveEducation designations.
Some incredible data are featured! 👇
Please RT. Link to report: spice.nursing.ubc.ca/
#bcpoli #bced #UBC ^JL
New report:
From Kindergarten to Post-Secondary: Educational Journeys of British Columbia’s Students with Disabilities & Learning Exceptionalities
We present Kindergarten-to-Post Secondary journeys of 68,000 BC #InclusiveEducation students.
Link: spice.nursing.ubc.ca/
^JL /1
UBC Inclusive Education Lab retweeted
New report:
From Kindergarten to Post-Secondary: Educational Journeys of British Columbia’s Students with Disabilities & Learning Exceptionalities
We present Kindergarten-to-Post Secondary journeys of 68,000 BC #InclusiveEducation students.
Link: spice.nursing.ubc.ca/
^JL /1
UBC Inclusive Education Lab retweeted
It's #NationalAccessAbilityWeek in Canada and this timely research report that we were proud to support has just been released!
#bced
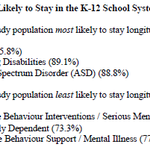
INFOGRAPHIC:
% of students, across #InclusiveEducation designations, who:
1. stayed longitudinally K-12
2. earned a Dogwood
3. transitioned to BC public post-sec (non-developmental) program
4. immediately after high school
Link to report: spice.nursing.ubc.ca/
#bced #bcpoli
UBC Inclusive Education Lab retweeted
73% of students with designation are NOT earning Dogwood and accessing post-secondary opportunities! No one should be ok with this.
These results need attention and leadership at all levels.
@BCSTA_news @BCPVPA @BCSSA
@RachnaSinghNDP @humanrights4BC
#bced #InclusiveEducation
INFOGRAPHIC:
% of students, across #InclusiveEducation designations, who:
1. stayed longitudinally K-12
2. earned a Dogwood
3. transitioned to BC public post-sec (non-developmental) program
4. immediately after high school
Link to report: spice.nursing.ubc.ca/
#bced #bcpoli
UBC Inclusive Education Lab retweeted
New thread today on post-secondary transitions among BC students with disabilities and learning exceptionalities.
Lots of valuable information here.
INFOGRAPHIC 🧵:
In our new public report, we explored #InclusiveEducation students' transitions across 4 stages.
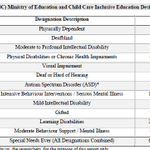
In this 🧵, we describe which educational journey was most common for each of the 13 designations.
Report link: spice.nursing.ubc.ca
#bced #bcpoli #UBC ^JL /1
UBC Inclusive Education Lab retweeted
My daughter was in this group. Looking across the reports we’ve done over the years, these students are streamed out of post secondary as a potential education stream from the time they’re in primary grades.
Replying to @InclusiveEdn
Most common educational journey for:
Designation A: Physically Dependent
63.2% of Designation A students in our study population followed the journey described in the infographic. /3
UBC Inclusive Education Lab retweeted
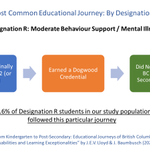
Most common educational journey for:
Designation R: Moderate Behaviour Support / Mental Illness
30.6% of Designation R students in our study population followed the journey described in the infographic. /14
UBC Inclusive Education Lab retweeted
Most common educational journey for:
Designation Q: Learning Disabilities
36.2% of Designation Q students in our study population followed the journey described in the infographic. /13
UBC Inclusive Education Lab retweeted
Most common educational journey for:
Designation P: Gifted
61.9% of Designation P students in our study population followed the journey described in the infographic. /12
UBC Inclusive Education Lab retweeted
Most common educational journey for:
Designation K: Mild Intellectual Disability
30.5% of Designation K students in our study population followed the journey described in the infographic. /11
UBC Inclusive Education Lab retweeted
Most common educational journey for:
Designation H: Intensive Behaviour Interventions / Serious Mental Illness
29.2% of Designation H students in our study population followed the journey described in the infographic. /10
UBC Inclusive Education Lab retweeted
Most common educational journey for:
Designation G: Autism Spectrum Disorder (ASD)
24.7% of Designation G students in our study population followed the journey described in the infographic. /9
UBC Inclusive Education Lab retweeted
Most common educational journey for:
Designation F: Deaf or Hard of Hearing
39.8% of Designation F students in our study population followed the journey described in the infographic. /8
UBC Inclusive Education Lab retweeted
Most common educational journey for:
Designation E: Visual Impairment
35.7% of Designation E students in our study population followed the journey described in the infographic. /7
UBC Inclusive Education Lab retweeted
Most common educational journey for:
Designation D: Physical Disabilities or Chronic Health Impairments
23.7% of Designation D students in our study population followed the journey described in the infographic. /6
UBC Inclusive Education Lab retweeted
Most common educational journey for:
Designation C: Moderate to Profound Intellectual Disability
52.4% of Designation C students in our study population followed the journey described in the infographic. /5
UBC Inclusive Education Lab retweeted
Most common educational journey for:
Designation B: Deafblind
50.0% of Designation B students in our study population followed the journey described in the infographic. /4