

Do you want to improve your trading? Do you want to learn how to manage?
United States
Joined January 2019
- Tweets61.1K
- Following408
- Followers686
- Likes2K

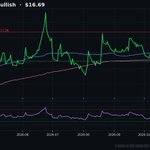





$AUPH Daily Analysis 🟢 Bullish
📍 $16.69 (+1.2% today) | 1M +0.5% | 3M +8.9%
🏁 vs S&P 500 (3M): 6.2% ahead
📊 What the chart says
• Uptrend: price above 50DMA ($16.26) and 200DMA ($15.58), with the 50 above the 200
• RSI 57 is neutral, MACD positive
• Volume 0.4x average: light, so conviction is low
🎯 Key levels
Resistance $17.36 (+4.0%)
Support $15.47 (-7.3%)
Reward:Risk to levels ≈ 0.6:1, limited upside before resistance
🔭 Scenarios (next 60 trading days)
🟢 Close above resistance $17.36 → room toward ~$18.26
🔴 Close below 50DMA $16.26 → risk of a move to ~$15.47
Typical range: $13.22 – $20.16
💵 Forward P/E: 15.6
🗓 Earnings in 19 days (Nov 09): expect bigger moves
💡 Takeaway: Trend is strong, but there is limited room before resistance. A pullback toward support or a confirmed breakout offers better risk/reward.
👉 𝐇𝐮𝐫𝐫𝐲 𝐮𝐩 𝐚𝐧𝐝 𝐜𝐡𝐞𝐜𝐤 𝐨𝐮𝐭 𝐭𝐡𝐞 𝐥𝐢𝐧𝐤 𝐢𝐧 𝐦𝐲 𝐛𝐢𝐨! @Interstocking

60
$SE Daily Analysis 🔴 Mildly Bearish
📍 $81.20 (-8.2% today) | 1M -20.9% | 3M -22.6%
🏁 vs S&P 500 (3M): 25.3% behind
📊 What the chart says
• Mixed trend: moving averages are not aligned
• RSI 22 is oversold, a bounce is possible, MACD negative
• Volume 2.5x average: strong participation behind the move
🎯 Key levels
Resistance $103.79 (+27.8%)
Support $75.49 (-7.0%)
Reward:Risk to levels ≈ 4.0:1, favorable skew
🔭 Scenarios (next 60 trading days)
🟢 Close above the 50DMA $106.55 → room toward ~$114.16
🔴 Close below support $75.49 → risk of a move to ~$67.88
Typical range: $51.72 – $110.68
🏦 Analysts: Strong Buy · avg target $154.75 (+91%)
💵 Forward P/E: 15.6
🗓 Earnings in 20 days (Nov 10): expect bigger moves
💡 Takeaway: Trend is weak. Buyers need to reclaim the 50DMA ($106.55) before the picture turns constructive.
👉 𝐇𝐮𝐫𝐫𝐲 𝐮𝐩 𝐚𝐧𝐝 𝐜𝐡𝐞𝐜𝐤 𝐨𝐮𝐭 𝐭𝐡𝐞 𝐥𝐢𝐧𝐤 𝐢𝐧 𝐦𝐲 𝐛𝐢𝐨! @Interstocking

32
$TEAM Daily Analysis 🟢 Bullish
📍 $220.47 (+2.7% today) | 1M +12.7% | 3M +158.2%
🏁 vs S&P 500 (3M): 155.5% ahead
📊 What the chart says
• Uptrend: price above 50DMA ($186.67) and 200DMA ($115.03), with the 50 above the 200
• RSI 67 shows strong momentum, approaching overbought, MACD positive
• Volume 0.5x average: light, so conviction is low
🎯 Key levels
Resistance $234.51 (+6.4%)
Support $168.05 (-23.8%)
Reward:Risk to levels ≈ 0.3:1, limited upside before resistance
🔭 Scenarios (next 60 trading days)
🟢 Close above resistance $234.51 → room toward ~$253.24
🔴 Close below 50DMA $186.67 → risk of a move to ~$168.05
Typical range: $147.95 – $292.99
🏦 Analysts: Buy · avg target $219.43 (-0%)
💵 Forward P/E: 32.7
🗓 Earnings in 16 days (Nov 06): expect bigger moves
💡 Takeaway: Trend is strong, but there is limited room before resistance. A pullback toward support or a confirmed breakout offers better risk/reward.
👉 𝐇𝐮𝐫𝐫𝐲 𝐮𝐩 𝐚𝐧𝐝 𝐜𝐡𝐞𝐜𝐤 𝐨𝐮𝐭 𝐭𝐡𝐞 𝐥𝐢𝐧𝐤 𝐢𝐧 𝐦𝐲 𝐛𝐢𝐨! @Interstocking

25
$NNE Daily Analysis 🔴 Bearish
📍 $12.97 (-0.3% today) | 1M -24.2% | 3M -25.1%
🏁 vs S&P 500 (3M): 27.8% behind
📊 What the chart says
• Downtrend: price below 50DMA ($16.86) and 200DMA ($22.51)
• RSI 33 shows weak momentum, MACD negative
• Volume 0.4x average: light, so conviction is low
🎯 Key levels
Resistance $17.44 (+34.5%)
Support $11.45 (-11.8%)
Reward:Risk to levels ≈ 2.9:1, favorable skew
🔭 Scenarios (next 60 trading days)
🟢 Close above the 50DMA $16.86 → room toward ~$18.90
🔴 Close below support $11.45 → risk of a move to ~$9.41
Typical range: $5.10 – $20.84
💵 Forward P/E: -12.9
💡 Takeaway: Trend is weak. Buyers need to reclaim the 50DMA ($16.86) before the picture turns constructive.
👉 𝐇𝐮𝐫𝐫𝐲 𝐮𝐩 𝐚𝐧𝐝 𝐜𝐡𝐞𝐜𝐤 𝐨𝐮𝐭 𝐭𝐡𝐞 𝐥𝐢𝐧𝐤 𝐢𝐧 𝐦𝐲 𝐛𝐢𝐨! @Interstocking

14
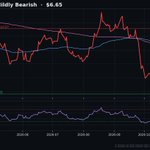
$OCUL Daily Analysis 🔴 Mildly Bearish
📍 $6.65 (+5.7% today) | 1M -33.4% | 3M -22.5%
🏁 vs S&P 500 (3M): 25.2% behind
📊 What the chart says
• Mixed trend: moving averages are not aligned
• RSI 33 shows weak momentum, MACD negative
• Volume 0.4x average: light, so conviction is low
🎯 Key levels
Resistance $10.57 (+58.9%)
Support $5.83 (-12.3%)
Reward:Risk to levels ≈ 4.8:1, favorable skew
🔭 Scenarios (next 60 trading days)
🟢 Close above the 50DMA $9.42 → room toward ~$10.51
🔴 Close below support $5.83 → risk of a move to ~$4.74
Typical range: $2.43 – $10.87
🏦 Analysts: Strong Buy · avg target $26.00 (+291%)
💵 Forward P/E: -4.5
🗓 Earnings in 14 days (Nov 04): expect bigger moves
💡 Takeaway: Trend is weak. Buyers need to reclaim the 50DMA ($9.42) before the picture turns constructive.
👉 𝐇𝐮𝐫𝐫𝐲 𝐮𝐩 𝐚𝐧𝐝 𝐜𝐡𝐞𝐜𝐤 𝐨𝐮𝐭 𝐭𝐡𝐞 𝐥𝐢𝐧𝐤 𝐢𝐧 𝐦𝐲 𝐛𝐢𝐨! @Interstocking

16
$RSP Daily Analysis 🟢 Bullish
📍 $215.73 (+1.1% today) | 1M +1.4% | 3M +1.8%
🏁 vs S&P 500 (3M): 0.9% behind
📊 What the chart says
• Uptrend: price above 50DMA ($215.15) and 200DMA ($205.59), with the 50 above the 200
• RSI 58 is neutral, MACD positive
• Volume 0.6x average: light, so conviction is low
🎯 Key levels
Resistance $218.76 (+1.4%)
Support $207.16 (-4.0%)
Reward:Risk to levels ≈ 0.4:1, limited upside before resistance
🔭 Scenarios (next 60 trading days)
🟢 Close above resistance $218.76 → room toward ~$222.81
🔴 Close below 50DMA $215.15 → risk of a move to ~$207.16
Typical range: $200.06 – $231.40
💡 Takeaway: Trend is strong, but there is limited room before resistance. A pullback toward support or a confirmed breakout offers better risk/reward.
👉 𝐇𝐮𝐫𝐫𝐲 𝐮𝐩 𝐚𝐧𝐝 𝐜𝐡𝐞𝐜𝐤 𝐨𝐮𝐭 𝐭𝐡𝐞 𝐥𝐢𝐧𝐤 𝐢𝐧 𝐦𝐲 𝐛𝐢𝐨! @Interstocking

11
$EWY Daily Analysis 🔴 Mildly Bearish
📍 $154.65 (-1.2% today) | 1M -18.2% | 3M -9.3%
🏁 vs S&P 500 (3M): 11.9% behind
📊 What the chart says
• Mixed trend: moving averages are not aligned
• RSI 34 shows weak momentum, MACD negative
• Volume 0.6x average: light, so conviction is low
🎯 Key levels
Resistance $192.87 (+24.7%)
Support $145.04 (-6.2%)
Reward:Risk to levels ≈ 4.0:1, favorable skew
🔭 Scenarios (next 60 trading days)
🟢 Close above the 50DMA $178.60 → room toward ~$191.42
🔴 Close below support $145.04 → risk of a move to ~$132.22
Typical range: $105.01 – $204.29
💡 Takeaway: Trend is weak. Buyers need to reclaim the 50DMA ($178.60) before the picture turns constructive.
👉 𝐇𝐮𝐫𝐫𝐲 𝐮𝐩 𝐚𝐧𝐝 𝐜𝐡𝐞𝐜𝐤 𝐨𝐮𝐭 𝐭𝐡𝐞 𝐥𝐢𝐧𝐤 𝐢𝐧 𝐦𝐲 𝐛𝐢𝐨! @Interstocking

9
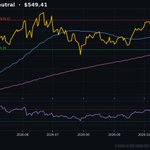
$SMH Daily Analysis 🟡 Neutral
📍 $549.41 (+0.2% today) | 1M -7.8% | 3M -6.4%
🏁 vs S&P 500 (3M): 9.1% behind
📊 What the chart says
• Pullback inside a long-term uptrend: below 50DMA ($577.95) but still above 200DMA ($513.17)
• RSI 36 shows weak momentum, MACD negative
• Volume 0.6x average: light, so conviction is low
🎯 Key levels
Resistance $639.47 (+16.4%)
Support $524.26 (-4.6%)
Reward:Risk to levels ≈ 3.6:1, favorable skew
🔭 Scenarios (next 60 trading days)
🟢 Close above the 50DMA $577.95 → room toward ~$611.47
🔴 Close below 200DMA $513.17 → risk of a move to ~$479.64
Typical range: $419.55 – $679.27
💡 Takeaway: Signals are mixed, with no clear edge. Let price confirm a direction first.
👉 𝐇𝐮𝐫𝐫𝐲 𝐮𝐩 𝐚𝐧𝐝 𝐜𝐡𝐞𝐜𝐤 𝐨𝐮𝐭 𝐭𝐡𝐞 𝐥𝐢𝐧𝐤 𝐢𝐧 𝐦𝐲 𝐛𝐢𝐨! @Interstocking

10
$ALK Daily Analysis 🔴 Bearish
📍 $34.62 (+1.9% today) | 1M -17.4% | 3M -21.9%
🏁 vs S&P 500 (3M): 24.6% behind
📊 What the chart says
• Downtrend: price below 50DMA ($40.63) and 200DMA ($44.59)
• RSI 31 shows weak momentum, MACD negative
• Volume 1.5x average: strong participation behind the move
🎯 Key levels
Resistance $42.06 (+21.5%)
Support $32.22 (-6.9%)
Reward:Risk to levels ≈ 3.1:1, favorable skew
🔭 Scenarios (next 60 trading days)
🟢 Close above the 50DMA $40.63 → room toward ~$43.83
🔴 Close below support $32.22 → risk of a move to ~$29.02
Typical range: $22.21 – $47.04
🏦 Analysts: Strong Buy · avg target $55.06 (+59%)
💵 Forward P/E: 10.3
🗓 Earnings in 1 days (Oct 21): expect bigger moves
💡 Takeaway: Trend is weak. Buyers need to reclaim the 50DMA ($40.63) before the picture turns constructive.
👉 𝐇𝐮𝐫𝐫𝐲 𝐮𝐩 𝐚𝐧𝐝 𝐜𝐡𝐞𝐜𝐤 𝐨𝐮𝐭 𝐭𝐡𝐞 𝐥𝐢𝐧𝐤 𝐢𝐧 𝐦𝐲 𝐛𝐢𝐨! @Interstocking

8
$JNUG Daily Analysis 🔴 Bearish
📍 $134.64 (+1.1% today) | 1M -22.9% | 3M +8.8%
🏁 vs S&P 500 (3M): 6.2% ahead
📊 What the chart says
• Downtrend: price below 50DMA ($169.65) and 200DMA ($191.69)
• RSI 41 is neutral, MACD negative
• Volume 0.4x average: light, so conviction is low
🎯 Key levels
Resistance $177.88 (+32.1%)
Support $118.50 (-12.0%)
Reward:Risk to levels ≈ 2.7:1, favorable skew
🔭 Scenarios (next 60 trading days)
🟢 Close above the 50DMA $169.65 → room toward ~$191.17
🔴 Close below support $118.50 → risk of a move to ~$96.98
Typical range: $51.29 – $217.99
💡 Takeaway: Trend is weak. Buyers need to reclaim the 50DMA ($169.65) before the picture turns constructive.
👉 𝐇𝐮𝐫𝐫𝐲 𝐮𝐩 𝐚𝐧𝐝 𝐜𝐡𝐞𝐜𝐤 𝐨𝐮𝐭 𝐭𝐡𝐞 𝐥𝐢𝐧𝐤 𝐢𝐧 𝐦𝐲 𝐛𝐢𝐨! @Interstocking

8
$MA Daily Analysis 🟢 Bullish
📍 $621.90 (+0.9% today) | 1M +9.7% | 3M +17.1%
🏁 vs S&P 500 (3M): 14.4% ahead
📊 What the chart says
• Uptrend: price above 50DMA ($577.13) and 200DMA ($531.89), with the 50 above the 200
• RSI 76 is overbought, so pullback risk is elevated, MACD positive
• Volume 0.5x average: light, so conviction is low
🎯 Key levels
Resistance $636.90 (+2.4%)
Support $544.58 (-12.4%)
Reward:Risk to levels ≈ 0.2:1, limited upside before resistance
🔭 Scenarios (next 60 trading days)
🟢 Close above resistance $636.90 → room toward ~$656.91
🔴 Close below 50DMA $577.13 → risk of a move to ~$544.58
Typical range: $544.40 – $699.39
🏦 Analysts: Strong Buy · avg target $674.25 (+8%)
💵 Forward P/E: 27.0
🗓 Earnings in 9 days (Oct 29): expect bigger moves
💡 Takeaway: Trend is strong, but momentum is stretched (overbought). A pullback or a confirmed breakout offers better risk/reward than chasing.
👉 𝐇𝐮𝐫𝐫𝐲 𝐮𝐩 𝐚𝐧𝐝 𝐜𝐡𝐞𝐜𝐤 𝐨𝐮𝐭 𝐭𝐡𝐞 𝐥𝐢𝐧𝐤 𝐢𝐧 𝐦𝐲 𝐛𝐢𝐨! @Interstocking

7
$SIMO Daily Analysis 🟡 Neutral
📍 $217.59 (+0.2% today) | 1M -19.1% | 3M -22.6%
🏁 vs S&P 500 (3M): 25.3% behind
📊 What the chart says
• Pullback inside a long-term uptrend: below 50DMA ($255.98) but still above 200DMA ($210.46)
• RSI 34 shows weak momentum, MACD negative
• Volume 0.3x average: light, so conviction is low
🎯 Key levels
Resistance $294.98 (+35.6%)
Support $194.47 (-10.6%)
Reward:Risk to levels ≈ 3.3:1, favorable skew
🔭 Scenarios (next 60 trading days)
🟢 Close above the 50DMA $255.98 → room toward ~$286.81
🔴 Close below 200DMA $210.46 → risk of a move to ~$194.47
Typical range: $98.18 – $337.00
🏦 Analysts: Strong Buy · avg target $369.70 (+70%)
💵 Forward P/E: 13.7
🗓 Earnings in 9 days (Oct 29): expect bigger moves
💡 Takeaway: Signals are mixed, with no clear edge. Let price confirm a direction first.
👉 𝐇𝐮𝐫𝐫𝐲 𝐮𝐩 𝐚𝐧𝐝 𝐜𝐡𝐞𝐜𝐤 𝐨𝐮𝐭 𝐭𝐡𝐞 𝐥𝐢𝐧𝐤 𝐢𝐧 𝐦𝐲 𝐛𝐢𝐨! @Interstocking

11
$ZVRA Daily Analysis 🔴 Mildly Bearish
📍 $10.47 (+3.0% today) | 1M -10.3% | 3M -13.8%
🏁 vs S&P 500 (3M): 16.5% behind
📊 What the chart says
• Mixed trend: moving averages are not aligned
• RSI 44 is neutral, MACD negative
• Volume 0.2x average: light, so conviction is low
🎯 Key levels
Resistance $11.58 (+10.7%)
Support $9.74 (-6.9%)
Reward:Risk to levels ≈ 1.5:1, favorable skew
🔭 Scenarios (next 60 trading days)
🟢 Close above the 50DMA $11.40 → room toward ~$12.36
🔴 Close below support $9.74 → risk of a move to ~$8.78
Typical range: $6.74 – $14.19
🏦 Analysts: Strong Buy · avg target $25.00 (+139%)
💵 Forward P/E: 9.7
🗓 Earnings in 15 days (Nov 04): expect bigger moves
💡 Takeaway: Trend is weak. Buyers need to reclaim the 50DMA ($11.40) before the picture turns constructive.
👉 𝐇𝐮𝐫𝐫𝐲 𝐮𝐩 𝐚𝐧𝐝 𝐜𝐡𝐞𝐜𝐤 𝐨𝐮𝐭 𝐭𝐡𝐞 𝐥𝐢𝐧𝐤 𝐢𝐧 𝐦𝐲 𝐛𝐢𝐨! @Interstocking

10
$AAOI Daily Analysis 🔴 Bearish
📍 $77.23 (-1.2% today) | 1M -28.9% | 3M -30.1%
🏁 vs S&P 500 (3M): 32.8% behind
📊 What the chart says
• Downtrend: price below 50DMA ($108.73) and 200DMA ($112.63)
• RSI 35 shows weak momentum, MACD negative
• Volume 0.6x average: light, so conviction is low
🎯 Key levels
Resistance $131.15 (+69.8%)
Support $63.87 (-17.3%)
Reward:Risk to levels ≈ 4.0:1, favorable skew
🔭 Scenarios (next 60 trading days)
🟢 Close above the 50DMA $108.73 → room toward ~$126.55
🔴 Close below support $63.87 → risk of a move to ~$46.05
Typical range: $8.23 – $146.23
🏦 Analysts: Buy · avg target $160.00 (+107%)
💵 Forward P/E: 16.8
🗓 Earnings in 17 days (Nov 06): expect bigger moves
💡 Takeaway: Trend is weak. Buyers need to reclaim the 50DMA ($108.73) before the picture turns constructive.
👉 𝐇𝐮𝐫𝐫𝐲 𝐮𝐩 𝐚𝐧𝐝 𝐜𝐡𝐞𝐜𝐤 𝐨𝐮𝐭 𝐭𝐡𝐞 𝐥𝐢𝐧𝐤 𝐢𝐧 𝐦𝐲 𝐛𝐢𝐨! @Interstocking

8
$T Daily Analysis 🔴 Mildly Bearish
📍 $23.54 (+1.5% today) | 1M -6.5% | 3M +3.3%
🏁 vs S&P 500 (3M): 0.6% ahead
📊 What the chart says
• Mixed trend: moving averages are not aligned
• RSI 45 is neutral, MACD negative
• Volume 0.4x average: light, so conviction is low
🎯 Key levels
Resistance $25.52 (+8.4%)
Support $21.96 (-6.7%)
Reward:Risk to levels ≈ 1.3:1, balanced
🔭 Scenarios (next 60 trading days)
🟢 Close above the 50DMA $24.67 → room toward ~$25.88
🔴 Close below support $21.96 → risk of a move to ~$20.75
Typical range: $18.86 – $28.22
🏦 Analysts: Buy · avg target $28.76 (+22%)
💵 Forward P/E: 9.2
🗓 Earnings in 1 days (Oct 21): expect bigger moves
💡 Takeaway: Trend is weak. Buyers need to reclaim the 50DMA ($24.67) before the picture turns constructive.
👉 𝐇𝐮𝐫𝐫𝐲 𝐮𝐩 𝐚𝐧𝐝 𝐜𝐡𝐞𝐜𝐤 𝐨𝐮𝐭 𝐭𝐡𝐞 𝐥𝐢𝐧𝐤 𝐢𝐧 𝐦𝐲 𝐛𝐢𝐨! @Interstocking

7
$FIGR Daily Analysis 🔴 Bearish
📍 $25.84 (+0.5% today) | 1M -26.8% | 3M -14.0%
🏁 vs S&P 500 (3M): 16.7% behind
📊 What the chart says
• Downtrend: price below 50DMA ($32.67) and 200DMA ($35.60)
• RSI 37 shows weak momentum, MACD negative
• Volume 0.4x average: light, so conviction is low
🎯 Key levels
Resistance $36.83 (+42.5%)
Support $22.72 (-12.1%)
Reward:Risk to levels ≈ 3.5:1, favorable skew
🔭 Scenarios (next 60 trading days)
🟢 Close above the 50DMA $32.67 → room toward ~$36.82
🔴 Close below support $22.72 → risk of a move to ~$18.57
Typical range: $9.74 – $41.94
🏦 Analysts: Buy · avg target $51.56 (+100%)
💵 Forward P/E: 13.7
🗓 Earnings in 23 days (Nov 12): expect bigger moves
💡 Takeaway: Trend is weak. Buyers need to reclaim the 50DMA ($32.67) before the picture turns constructive.
👉 𝐇𝐮𝐫𝐫𝐲 𝐮𝐩 𝐚𝐧𝐝 𝐜𝐡𝐞𝐜𝐤 𝐨𝐮𝐭 𝐭𝐡𝐞 𝐥𝐢𝐧𝐤 𝐢𝐧 𝐦𝐲 𝐛𝐢𝐨! @Interstocking

7
$STRK Daily Analysis 🟡 Neutral
📍 $71.10 (-0.4% today) | 1M -6.8% | 3M +17.2%
🏁 vs S&P 500 (3M): 14.6% ahead
📊 What the chart says
• Pullback inside a long-term uptrend: below 50DMA ($72.36) but still above 200DMA ($69.82)
• RSI 40 is neutral, MACD negative
• Volume 1.3x average: strong participation behind the move
🎯 Key levels
Resistance $77.13 (+8.5%)
Support $68.25 (-4.0%)
Reward:Risk to levels ≈ 2.1:1, favorable skew
🔭 Scenarios (next 60 trading days)
🟢 Close above the 50DMA $72.36 → room toward ~$76.16
🔴 Close below 200DMA $69.82 → risk of a move to ~$68.25
Typical range: $56.39 – $85.81
💡 Takeaway: Signals are mixed, with no clear edge. Let price confirm a direction first.
👉 𝐇𝐮𝐫𝐫𝐲 𝐮𝐩 𝐚𝐧𝐝 𝐜𝐡𝐞𝐜𝐤 𝐨𝐮𝐭 𝐭𝐡𝐞 𝐥𝐢𝐧𝐤 𝐢𝐧 𝐦𝐲 𝐛𝐢𝐨! @Interstocking

12
$ARWR Daily Analysis 🟡 Neutral
📍 $58.65 (+2.5% today) | 1M -14.7% | 3M -33.9%
🏁 vs S&P 500 (3M): 36.6% behind
📊 What the chart says
• Mixed trend: moving averages are not aligned
• RSI 34 shows weak momentum, MACD positive
• Volume 0.4x average: light, so conviction is low
🎯 Key levels
Resistance $72.49 (+23.6%)
Support $54.53 (-7.0%)
Reward:Risk to levels ≈ 3.4:1, favorable skew
🔭 Scenarios (next 60 trading days)
🟢 Close above the 50DMA $74.35 → room toward ~$79.86
🔴 Close below support $54.53 → risk of a move to ~$49.02
Typical range: $37.33 – $79.98
🏦 Analysts: Strong Buy · avg target $107.71 (+84%)
💵 Forward P/E: -11.8
🗓 Earnings in 36 days (Nov 25): expect bigger moves
💡 Takeaway: Signals are mixed, with no clear edge. Let price confirm a direction first.
👉 𝐇𝐮𝐫𝐫𝐲 𝐮𝐩 𝐚𝐧𝐝 𝐜𝐡𝐞𝐜𝐤 𝐨𝐮𝐭 𝐭𝐡𝐞 𝐥𝐢𝐧𝐤 𝐢𝐧 𝐦𝐲 𝐛𝐢𝐨! @Interstocking

8
$MCD Daily Analysis 🟡 Neutral
📍 $245.74 (+1.3% today) | 1M -0.9% | 3M -6.1%
🏁 vs S&P 500 (3M): 8.8% behind
📊 What the chart says
• Downtrend: price below 50DMA ($250.70) and 200DMA ($282.25)
• RSI 57 is neutral, MACD positive
• Volume 0.4x average: light, so conviction is low
🎯 Key levels
Resistance $252.29 (+2.7%)
Support $229.20 (-6.7%)
Reward:Risk to levels ≈ 0.4:1, limited upside before resistance
🔭 Scenarios (next 60 trading days)
🟢 Close above the 50DMA $250.70 → room toward ~$259.44
🔴 Close below support $229.20 → risk of a move to ~$220.46
Typical range: $211.87 – $279.60
🏦 Analysts: Buy · avg target $292.03 (+19%)
💵 Forward P/E: 17.9
🗓 Earnings in 15 days (Nov 04): expect bigger moves
💡 Takeaway: Signals are mixed, with no clear edge. Let price confirm a direction first.
👉 𝐇𝐮𝐫𝐫𝐲 𝐮𝐩 𝐚𝐧𝐝 𝐜𝐡𝐞𝐜𝐤 𝐨𝐮𝐭 𝐭𝐡𝐞 𝐥𝐢𝐧𝐤 𝐢𝐧 𝐦𝐲 𝐛𝐢𝐨! @Interstocking

8