

Building world’s 1st ₿itcoin & AI IR firm @OGAdvisors | Research @Finblueprint | @VillanovaU ‘16
👇Institutional-Level Research
Joined August 2021
- Tweets18.4K
- Following363
- Followers23.9K
- Likes25.2K





Pinned Tweet
My working thesis is that the market, particularly across AI and data center infrastructure, is increasingly pricing in the probability of a Democratic sweep in November. If this plays out I suspect much of the political and regulatory uncertainty will have already been discounted by the time we get to the midterms.
My base case is that we establish a bottom ahead of the election, see some consolidation as the results and policy implications are digested, and then enter a much more constructive environment heading into 2027.
The underlying demand for compute and power infrastructure isn't going away, irrespective of who controls Congress. I think the market is conflating near-term political uncertainty with a structural impairment to the LT investment thesis.
Once that uncertainty begins to clear, attention should shift back toward fundamentals, execution, and capital deployment. Assuming liquidity conditions are supportive, I think smaller-cap infrastructure names could be among the biggest beneficiaries of that rotation.
In other words, I suspect the political cycle is influencing the timing of the opportunity far more than its underlying economics. Yes I know yields are higher too...but guess what? Get used to it that's the environment we're in and until economic productivity deteriorates it won't really affect the market as bad as you think (otherwise indexes wouldn't be at ATHs)

Danny Marques | Investing Informant retweeted

IREN - Almost to the spot where I've been calling for a bounce. No clue if we get it or not, it's just what it's done twice before. What IS different this time is that it's formed a not so clean head and shoulders. I really like clean setups but am continuing to do my best to provide my own play by play here. Currently, I believe we will bounce around $24.50, however, I'm afraid we are targeting the bubbled swing low longer term. If we were to reach that target, it would look like the major trendline was broken, just a heads up!

Make sure you tune in

$BGDE will release its Q3 2026 financial results after market close on Thursday, November 5, 2026.
Management will host a conference call and webcast on Thursday, November 5 at 5:00 p.m. ET to discuss the results.
Register here: edge.media-server.com/mmc/p/…
The importance of the 0.786 fibonnaci retracement on any stock is your best friend. I don't care what your fundamentals say, a stock almost NEVER clears through this fib on its first attempt in years after losing it during a secular downtrend
Moderna $MRNA
@cantonmeow

Gotta give credit where it's due. Big Mike has absolutely crushed it getting the counts right on these HPC/AI stocks all year $IREN $CIFR $HUT $WULF
@Michael_EWpro
Not sure why he has me blocked tho lol!
I got a lot of criticism when I said that many of these neoclouds like $NBIS were NOT going to see all time highs again for a while
We're entering a period where discounts and real opportunities are beginning to emerge but notice how FEAR is controlling the narrative. That's the signal

Nebius $NBIS has now recovered and quickly bounced back to $200+. It will face a challenge to get past $229-260.
I don't expect to see a new ATH anytime soon, in fact I see it form a lower high and you'll be able to buy this near or lower than $150 again in the next few months

Danny Marques | Investing Informant retweeted

@cantonmeow made a great video recently about the importance of the 0.886 fib, especially when a stock pushes past the 1 multiple and doesn't extend all the way to the 1.618.
He may be right (once again), as $IREN is showing early signs of wanting to revisit that same fib at around $19.40.
It would be one more to add to the list.

It's going to look comical in retrospect if $IREN and $CIFR find support along these long-term rising trendlines before entering their next major expansion phase.
The underlying fundamentals of AI infrastructure remain as bullish as ever, but the market is undergoing a broader recalibration of expectations, particularly for companies that have yet to fully deliver on their development pipelines.
It's not necessarily questioning whether the capacity is needed. It's repricing the cost of capital, execution risk, and the time required to convert development pipelines into contracted, revenue-generating infrastructure. A repricing of execution risk is normal, and sensible.
Both charts are approaching technically significant areas of support. I continue to believe we're looking at a cyclical correction within a much larger structural expansion.
@cantonmeow @CrypticTrades_ @Freedom_By_40 @Fibonacci_TA @chad_ventures @AlemzadehC

If we're going to be purely technical about it, it's entirely possible they run $IREN to $19 and that's where it'll bottom right at the trendline, similar to how Bitcoin bitcoin:native formed a bottom

The market is running a remarkably similar playbook to what we saw with Bitcoin bitcoin:native near $58K, only now we're seeing it play out across AI infrastructure stocks like $CIFR
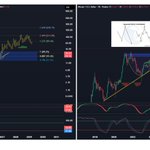
Look at the similarities in these 2 monthly charts.
bitcoin:native found its bottom around the 0.887 fib, while $CIFR has now broken below its equivalent level with the next major support around the 0.786 at $7.
Both exhibit characteristics of an expanded flat correction within a much larger bullish structure. Notice how FEAR tends to PEAK around these levels, when investors increasingly mistake a cyclical correction for a structural breakdown.

$IREN vs $CIFR have two very different but also similar technical structures. Both have endured substantial corrections amid the broader weakness in AI infrastructure, but an important distinction in where each sits relative to its long-term technical structure.
$IREN hit its macro 1.272 fib at $69 before this correction. A correction of this magnitude isn't particularly unusual, especially following the first test of an important macro extension.
$CIFR fell short of its 1.272 extension at $42 and has now retraced to its 0.887 fib which converges with a significant historical demand zone and the vicinity of its longer-term ascending trendline.
From a purely technical perspective, CIFR's is already testing, and marginally undercutting, an area of support that IREN has yet to revisit on a comparable basis.
For IREN, that equivalent 0.887 retracement sits near $19.40, roughly 30% below current levels, and coincides with the broader trendline structure I've drawn.
That doesn't mean IREN needs to trade there. But it illustrates why I see a more immediately identifiable technical risk/reward setup developing in CIFR.
Sentiment across AI infrastructure has deteriorated considerably, and we're seeing the kind of fear and volatility that historically accompanies important inflection points.
But the indicators I track aren't yet suggesting that the selling is conclusively over. Both of these have lost important monthly EMAs like the 21m EMA which in my experience ends a trend. IREN would need to reclaim $34 by month-end and CIFR $13. Until that happens, one needs to remain open to further weakness in months ahead, even if we experience a sharp relief rally.
And yet, when I consider what these businesses are building, their expanding contractual commitments, and the earnings potential emerging over the next 12-18 months, it's difficult not to be interested at these prices.
It reminds me of April 2025, when several names across the sector lost important technical levels, sentiment collapsed, and what appeared to be a breakdown ultimately developed into one of the more attractive entry opportunities of the cycle. I've followed this sector long enough to recognize that the greatest asymmetries come when the prevailing narrative becomes overwhelmingly negative and price begins discounting outcomes considerably worse than what the underlying fundamentals are showing.
It's not supposed to be comfortable. But I do think we're in an area where the longer-term risk/reward is becoming increasingly compelling, particularly for investors who can look beyond the next several months.
Just be disciplined in your accumulation, position sizing, and be patient.

A new bull market has started in $MSTR but you don't see or hear anyone talking about it yet.
That's ok and it's great because it means we're still early but when price is much higher and Bitcoin bitcoin:native is breaking ATH, you'll definitely hear all the bullish takes again

Danny Marques | Investing Informant retweeted

Necessity is the mother of invention.
AI compute can't wait years for grid connections, so it's adapting to travel to the power faster than ever.
Compute is becoming mobile. Power isn't.
Having the power is the asset. $BGDE

NVIDIA $NVDA JUST INTRODUCED DSX POD, AI DATA CENTERS THAT SHIP IN CONTAINERS
Each one arrives with computing, cabling, power, and liquid cooling already installed, built around Nvidia's Vera Rubin systems. That cuts setup time at a ready site from 6 months to as little as 14 days.
Partners plan to deliver them worldwide in early 2027.
Jensen Huang: "An AI factory creates value when it starts producing tokens, not when construction is complete."
“With NVIDIA DSX POD, we’re bringing factory-built precision and speed to AI infrastructure construction — reducing deployment time from months to weeks so customers can scale capacity and bring revenue-generating production online faster.”

$NUAI BANG 🎯
We only go up from here now. Thanks for playing
$NUAI | Understanding the technical structure and where we go from here.
A few observations, particularly the extraordinary selling pressure we've seen over the past month. But first, there's an important limitation worth acknowledging.
Unlike companies such as $GOOGL , $AMZN, or even $IREN , we don't have the benefit of decades of trading history to evaluate NUAI's long-term technical structure. With <2 years of meaningful price history, we have few reference points to work with. It simply means we need to be more measured in the conclusions we draw.
BUT from the price history we do have, the market has been communicating something fairly consistently. For much of the past year, $NUAI has traded within a broad range between approximately $3 and $6, repeatedly struggling to sustain advances beyond the 0.786 fib near $5.64.
I've highlighted the descending resistance line that has rejected price on multiple occasions. Post-PPA we briefly broke above that resistance, even registering a weekly close above it, but there was no sustained follow-through.
Instead, price reversed sharply and ultimately surrendered the entire breakout. This is why confirmation matters. A breakout isn't validated simply because price moves above resistance. You want to see buyers sustain that move, establish acceptance above the previous range, and ideally defend that level on a subsequent retest. We didn't get any of that.
And importantly, this happened despite positive fundamental developments at the company. Use this as a useful reminder that a bullish catalyst and bullish price action aren't necessarily the same thing. The market can acknowledge operational progress while simultaneously reducing the valuation it's willing to assign to that progress.
So where does that leave us today?
Following nearly a month of relentless selling, we're now seeing the first signs of potential stabilization around $3.06, corresponding to the 0.618 fib. This is an important technical area, particularly given the magnitude of the correction and the substantial increase in trading volume accompanying the decline.
But I wouldn't suggest the bottom has been confirmed. The broader blue-shaded region between approximately $2 and $3.50 represents an area of historical price activity where buyers have previously demonstrated interest. It's the region for accumulation.
Could we still revisit the mid-$2s, or even the 0.5 fib at $1.99? Possible. But I suspect a considerable amount of fear has already been reflected in the stock price.
The momentum indicators I track haven't yet demonstrated the kind of bullish divergence or sustained recovery that would give me greater confidence the corrective process is complete. And after a decline of this magnitude, some additional consolidation wouldn't surprise me.
I overlaid a fractal from $IREN's 2025 correction to illustrate one possible recovery trajectory. It's not a forecast, nor am I suggesting NUAI must replicate that move. It's simply a useful illustration of how a stock can experience a sharp breakdown, retest a historical demand region, and eventually recover into its former trading range.
For now, I'd be watching three areas:
- $3.06: Immediate support and the first area where I'd want to see stabilization.
- $2–$2.50: A deeper demand region if the corrective process extends.
- $5.64: A resistance level that needs to be reclaimed and sustained to improve the broader technical outlook. Until this is convincingly reclaimed, remain open to further consolidation and volatility.
Now, here's where I think the longer-term perspective becomes important.
NUAI has made meaningful progress building its development platform, including its 207 MW power agreement at TCDC, securing the associated letter of credit, and assembling a team with substantial hyperscale infrastructure experience.
But the equity is still being valued against significant commercial, financing, and execution milestones that remain ahead.
I believe the opportunity for companies controlling strategically located power and capable of developing AI infrastructure remains substantial. But the market is currently placing a much greater emphasis on how these projects will ultimately be commercialized and financed. A strong LT thesis doesn't eliminate near-term technical risk, just as a deteriorating technical structure doesn't automatically invalidate the underlying business opportunity.
For investors approaching the opportunity with a multiyear horizon, you should be increasingly interested in the risk/reward developing at $3.
But I'm also comfortable allowing the bottoming process to unfold. There's no requirement that the stock immediately recover simply because it has corrected substantially.
The objective isn't to predict a bottoms but to recognize where a potentially attractive opportunity is developing, understand what could invalidate that thesis, and position accordingly.

Danny Marques | Investing Informant retweeted

$NUAI has been hammered. High $7s after the Vistra PPA, now in the $2s.
I've talked about this name a lot, so I'm not going quiet now. I've made some bad calls before and I'll prob make more. I don't think this is one of them.
The co controls 493 acres in Odessa w/ a signed 20-yr PPA for up to 207MW from Vistra. LT the site has potential for up to 1.4GW. Power is still one of the biggest bottlenecks in AI infra, and I don't think the mkt appreciates what this asset could be worth w/ the right tenant.
Mgmt. has been substantially rebuilt w/ real experience in hyperscale DC development and financing.
But a PPA isn't a lease. And a lease isn't a finished, income producing DC.
The co still needs a tenant, construction financing on decent terms, permitting and ultimately delivery. Dilution is a real concern, particularly at these prices, and financing costs aren't getting easier. None of this is trivial.
At a mkt cap of c.$300M, I think the asymmetry is extraordinary if mgmt pulls this off. The opportunity hasn't deteriorated anywhere near as much as the price.
I added yesterday at $2.82. Position: 120,888 shares, plus long Jan '27 $7.50 calls.
Plenty of ppl here own this, some much higher. I won't tell you to hold, buy or sell. Make your own call.
If the tenant doesn't materialize, or the financing wrecks the economics for common SHs, my thesis changes.
Until then, I think the mkt has this one very wrong.
This comment from Chris is incredibly profound as I think about itt. There's actually a much bigger lesson here about how markets function and where individual investors can have an advantage.
We tend to think of "smart money" as this sophisticated, coordinated group of institutions that collectively understands something the rest of the market doesn't. But the reality is that these institutions are all competing against one another, often operating under completely different mandates, constraints, investment horizons, and risk tolerances.
Think about the extraordinary amounts of money being spent on quant research, proprietary data, computing infrastructure, AI models, and increasingly GPUs to process information faster and find some incremental advantage over competing funds. It's an enormous arms race to extract increasingly small informational and execution advantages. And yet, despite all those resources, the majority of active PMs still struggle to outperform a passive index over long periods lol
It should be fascinating because it raises an important question....What exactly makes money "smart"? Is it the amount of capital someone manages, the sophistication of their tools, or their ability to correctly understand where value will accrue over time?
A large institution might have a better understanding of market positioning, liquidity, and near-term flows than I ever will. But that doesn't automatically mean it has a better understanding of what a business or an entire industry could look like 5 years from now. And THIS is where I think individual investors have an advantage that is almost universally underappreciated.
We have the luxury of time. We don't have to outperform a benchmark every quarter, defend a position to a committee, or reduce exposure because a portfolio's volatility has exceeded some predetermined risk limit. We can afford to think in years and can own smaller businesses that aren't yet investable at institutional scale. We can sit in cash when opportunities aren't compelling and hold through volatility when our underlying thesis remains intact. It's an extraordinary amount of flexibility and perhaps most importantly, we don't have to turn every new piece of information into an immediate trading decision.
There's also an underappreciated informational advantage in being close to the actual market conversation. Spend enough time observing how investors behave, what narratives they're embracing, which fears are being repeated, and how sentiment evolves, and you begin to recognize patterns that aren't necessarily captured by traditional financial models. That's being on X is for and why it's such a good barometer / signal for sentiment.
There's meaningful information in understanding the difference between a deterioration in business fundamentals and a deterioration in how investors feel about those fundamentals.
What fascinates me is that institutions can recognize the enormous LT opportunity and still become forced sellers of companies positioned to benefit from it. They may have vastly more information, faster execution, better models, but none of those advantages can manufacture patience, eliminate institutional constraints, or guarantee good judgment.
If you can develop genuine conviction through independent research, understand what you're underwriting, and structure your investments so that time works in your favor rather than against you, you may have an advantage that is difficult for even the most sophisticated institution to replicate.

Danny Marques | Investing Informant retweeted
$NUAI | Understanding the technical structure and where we go from here.
A few observations, particularly the extraordinary selling pressure we've seen over the past month. But first, there's an important limitation worth acknowledging.
Unlike companies such as $GOOGL , $AMZN, or even $IREN , we don't have the benefit of decades of trading history to evaluate NUAI's long-term technical structure. With <2 years of meaningful price history, we have few reference points to work with. It simply means we need to be more measured in the conclusions we draw.
BUT from the price history we do have, the market has been communicating something fairly consistently. For much of the past year, $NUAI has traded within a broad range between approximately $3 and $6, repeatedly struggling to sustain advances beyond the 0.786 fib near $5.64.
I've highlighted the descending resistance line that has rejected price on multiple occasions. Post-PPA we briefly broke above that resistance, even registering a weekly close above it, but there was no sustained follow-through.
Instead, price reversed sharply and ultimately surrendered the entire breakout. This is why confirmation matters. A breakout isn't validated simply because price moves above resistance. You want to see buyers sustain that move, establish acceptance above the previous range, and ideally defend that level on a subsequent retest. We didn't get any of that.
And importantly, this happened despite positive fundamental developments at the company. Use this as a useful reminder that a bullish catalyst and bullish price action aren't necessarily the same thing. The market can acknowledge operational progress while simultaneously reducing the valuation it's willing to assign to that progress.
So where does that leave us today?
Following nearly a month of relentless selling, we're now seeing the first signs of potential stabilization around $3.06, corresponding to the 0.618 fib. This is an important technical area, particularly given the magnitude of the correction and the substantial increase in trading volume accompanying the decline.
But I wouldn't suggest the bottom has been confirmed. The broader blue-shaded region between approximately $2 and $3.50 represents an area of historical price activity where buyers have previously demonstrated interest. It's the region for accumulation.
Could we still revisit the mid-$2s, or even the 0.5 fib at $1.99? Possible. But I suspect a considerable amount of fear has already been reflected in the stock price.
The momentum indicators I track haven't yet demonstrated the kind of bullish divergence or sustained recovery that would give me greater confidence the corrective process is complete. And after a decline of this magnitude, some additional consolidation wouldn't surprise me.
I overlaid a fractal from $IREN's 2025 correction to illustrate one possible recovery trajectory. It's not a forecast, nor am I suggesting NUAI must replicate that move. It's simply a useful illustration of how a stock can experience a sharp breakdown, retest a historical demand region, and eventually recover into its former trading range.
For now, I'd be watching three areas:
- $3.06: Immediate support and the first area where I'd want to see stabilization.
- $2–$2.50: A deeper demand region if the corrective process extends.
- $5.64: A resistance level that needs to be reclaimed and sustained to improve the broader technical outlook. Until this is convincingly reclaimed, remain open to further consolidation and volatility.
Now, here's where I think the longer-term perspective becomes important.
NUAI has made meaningful progress building its development platform, including its 207 MW power agreement at TCDC, securing the associated letter of credit, and assembling a team with substantial hyperscale infrastructure experience.
But the equity is still being valued against significant commercial, financing, and execution milestones that remain ahead.
I believe the opportunity for companies controlling strategically located power and capable of developing AI infrastructure remains substantial. But the market is currently placing a much greater emphasis on how these projects will ultimately be commercialized and financed. A strong LT thesis doesn't eliminate near-term technical risk, just as a deteriorating technical structure doesn't automatically invalidate the underlying business opportunity.
For investors approaching the opportunity with a multiyear horizon, you should be increasingly interested in the risk/reward developing at $3.
But I'm also comfortable allowing the bottoming process to unfold. There's no requirement that the stock immediately recover simply because it has corrected substantially.
The objective isn't to predict a bottoms but to recognize where a potentially attractive opportunity is developing, understand what could invalidate that thesis, and position accordingly.