

Quantitative Ecologist
Christchurch, New Zealand
Joined August 2013
- Tweets161
- Following305
- Followers59
- Likes50



3D printed topographic model of the Otama catchment, made using #Rayshader in #Rstats with #Linz 1m LiDAR DEM.


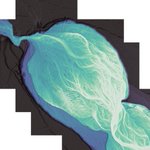
The #python package #RiverREM was a big help in making this Relative Elevation Model of the Waimakariri River. It's not only quicker, but reproducible and scalable too.
isaacbain.com/posts/rem/


2
66
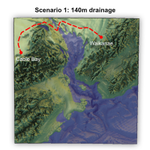
What would it look like to drain the Cook Strait - which separates the North and South Islands of New Zealand? combining @gebcobathymetry with #rayshader.
isaacbain.com/posts/draining…


I love that just using the power of #Rstats and #rayshader its possible to delineate catchment boundaries, download and process elevation data, and create .stl files for 3D printing.
Check out this one for the Upper Ruamahanga: isaacbain.com/posts/upper-ru…


Elevation models of the Whangateau, Kakanui, and Ahuriri catchments.
Read more here: isaacbain.com/posts/3d-print…
1
46
I've been trying out @kyle_e_walker's new #rstats package {mapgl}. It's pretty incredible to be able to view these 3D rendered hex grid cells of livestock density all in the browser. And compare between two years!
isaacbain.com/posts/livestoc…
This week, I used bivariate maps to explore the relationship between livestock density 🐄 and water quality 💧 in New Zealand. Bivariate maps are great because they allow you to visualise two variables at once, using a grid of intersecting colour scales.


1
4
77
This allows you to answer questions such as:
- Which areas are doing well and have comparatively good water quality for a given number of livestock?
- Which areas exhibit poor water quality despite low stocking density, potentially due to other influences such as urban land use?
1
39
Read more on my blog: isaacbain.com/posts/bivariat…

34
The Climate Data Initiative has released new climate projection datasets for New Zealand. 🌏
Discover more: isaacbain.com/posts/climate-…
1
38


🏡 3 in 4 people (76.3%) live in the North Island of New Zealand.
🌆 1 in 3 people (33.2%) live in Auckland.
🏔️ That leaves around 1.2 million people spread throughout the South Island.
🏙️ And around 0.5 million of those live in the greater Christchurch area alone!
1
47
More details posted here: isaacbain.com/posts/3d-popul…
22
If you're a keen tramper 🥾, you likely know about the great work the Permolat Trust does in maintaining a network of 70 iconic backcountry huts 🛖 that are too small or remote for DOC to manage.
1
22
As a regular user of their website, I noticed it was challenging to explore new huts without an overview map 🗺️. So, I created one and added it to their website! Read more: isaacbain.com/posts/remote-h…

1
19
I've just published a new blog post on my website exploring Stats NZ's prototype population grids. This high-resolution dataset from Stats NZ provides detailed insights for urban planning 🏙️, environmental management 🌿, and public health 🏥.

1
40
🔗 You can read more about it here: isaacbain.com/posts/populati…

18
🌿 If you use R and regularly access environmental data from Koordinates-based websites (like MfE's data service), I have developed a quick API 🔧 that could make your life easier and avoid the need to download files 📂 to your desktop.
1
31
🔗 📖 You can read more about it here: isaacbain.com/posts/koordina…
And, so that y'all would have something to look at, I also created this graph of CO2 concentrations at Baring Head by using the API to pull data directly into R from the MfE data service 📈.
27