

i don't use this account anymore. find me on bsky!
Toronto
Joined March 2015
- Tweets1.6K
- Following861
- Followers2.2K
- Likes4.2K






That's it! This was my 4th #30DayMapChallenge, and the first time I finished all 30 maps. Fun as always, & so cool to see everyone's creations this month.

The final map for #30daymapchallenge 2024: connecting the end points of the London Underground by line.
Code: github.com/ivabrunec/30dayma…

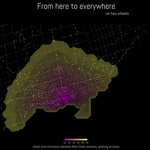
Catching up on day 17 of #30daymapchallenge. Isochrones representing travel time from the Union bike share station to all other Toronto bike share stations. You can get far on two wheels.
Just today's map left!
Code: github.com/ivabrunec/30dayma…

And because it is Friday, for day 29 of #30daymapchallenge, a map of every pub in London. Data from the Overture Places dataset.
Code: github.com/ivabrunec/30dayma…


Day 28 of #30daymapchallenge: The blue planet.
Bathymetry of the Pacific Ocean & a reminder only ~25% of the ocean floor has been mapped in detail.
Code: github.com/ivabrunec/30dayma…

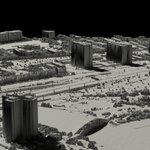
Feels like dark days for Toronto cyclists and pedestrians. For day 27 of #30daymapchallenge, a micro-map of the Humber River Bridge and the waterfront trail, looking north at the many lanes of the Gardiner/Lakeshore.
Code: github.com/ivabrunec/30dayma…

Just a quick one to catch up with day 26 of #30daymapchallenge: Projections. New Zealand in a few different projections.
Code: github.com/ivabrunec/30dayma…

Worldwide average temperature anomaly, 2023. #30daymapchallenge, day 25: heat.
Oof.
Code: github.com/ivabrunec/30dayma…

Day 24 of #30daymapchallenge: circular shapes only. Soil types of Canada, in point form.
w/ thanks to @geokaramanis for the pixel point approach I borrowed here!
Code: github.com/ivabrunec/30dayma…

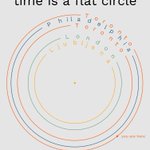
Day 23 of #30daymapchallenge (last week!). Memory.
Not really a map, or I guess call it an attempt at mapping time. Years lived in different cities.
Code: github.com/ivabrunec/30dayma…

Day 22 of #30daymapchallenge: 2 colors.
Because it's always fun to map your hometown: residential & non-residential buildings in Ljubljana, Slovenia.
Code: github.com/ivabrunec/30dayma…

Day 21 of #30daymapchallenge: Conflict.
% of residents per country experiencing crisis-level or worse food insecurity, as defined by the Integrated Food Security phase classification.
Many of these are the result of war and conflict.
Code: github.com/ivabrunec/30dayma…
Day 20 of #30daymapchallenge: OpenStreetMap data.
Chicago in polygons.
Code: github.com/ivabrunec/30dayma…

Day 19 of #30daymapchallenge: Typography.
6 subway networks with distinctive typographies: London, NYC, Paris, Seoul, Montreal & Toronto. 🚇
Code: github.com/ivabrunec/30dayma…

Day 18 of #30daymapchallenge: 3D. One from the bucket list.
Milford Sound/Piopiotahi, New Zealand. #rayshader
Code: github.com/ivabrunec/30dayma…


Choropleth map for day 16 of #30DayMapChallenge: patterns of temperature & precipitation by US county.
Approach heavily borrowed from @VictimOfMaths sun vs rain map of the UK (original in 🧵)!
Code: github.com/ivabrunec/30dayma…

Original: nitter.gq/VictimOfMaths/status/1…

I accidentally made a map comparing rainfall and sunshine hours across the UK in 2021.
Conclusive proof that Yorkshire>Lancashire (among other things).
High-res version here: github.com/VictimOfMaths/Map…

Day 15 of #30DayMapChallenge: My data. GPX tracks of the hikes I've done in 2024. #rayshader of course.
Code: github.com/ivabrunec/30dayma…


