

Following technology, business fundamentals, and changing market cycles. Data before hype and discipline before emotion. Educational only—not financial advice.
Joined April 2009
- Tweets245K
- Following227
- Followers5.2K
- Likes148K







AI demand is real. But the cost of scaling it is becoming harder to ignore.
$SKHynix just reported record Q3 revenue of KRW 104.6T and operating profit of KRW 83.3T, fueled by surging AI memory demand.
At the same time, a reported $63B financing package for Anthropic’s AI infrastructure highlights just how much capital this buildout requires.
Two things can be true at once:
• AI infrastructure demand is accelerating.
• The returns on that investment still need to justify the cost.
The next phase of the AI trade may depend less on spending announcements and more on who can turn that spending into sustainable cash flow.
Who do you think captures the most value from this cycle: chipmakers, cloud providers, or AI model developers?
$NVDA $AVGO $MU $MSFT $AMZN
The Nasdaq is trying to stabilize, but the 50-day MA remains a key hurdle.
The Nasdaq Composite closed Monday back above 26,063, a key retracement level, but it still needs to reclaim the 50-day moving average near 26,600 to strengthen the short-term setup.
If momentum fades, 25,803 is the next downside level I’m watching. Until resistance is reclaimed, I’d be cautious about treating a bounce as a confirmed trend reversal.
That makes this week’s mega-cap earnings especially important.
With $MSFT, $GOOGL, and $AMZN reporting, the market needs evidence that rising AI capex is translating into sustainable revenue growth, operating leverage, and stronger free cash flow.
I’ll be watching:
• AI monetization and demand
• Capex growth versus expected returns
• Forward guidance and free cash flow
Can earnings provide the catalyst for the Nasdaq to reclaim resistance, or will elevated expectations keep the rally in check?
$NDX $QQQ $NVDA $MSFT $GOOGL $AMZN
A good watchlist saves you from chasing every stock that starts running. I've updated mine with the chart patterns and price levels I'm watching. Want the list? Just DM me or follow along.

$SPCX IS UP NEARLY 10% — BUT $166.18 REJECTED THE FIRST PUSH.
Earnings brought the buyers in. Now the chart has to prove this isn't just a spike.
Reclaim $162.50 → $164.00–$164.70 back in play.
Lose $161.15 → $159.50–$160.00 comes back into focus.
$166.18 is still the high bulls need to beat.
Continuation or a post-earnings fade?


$TICKER BOUNCED OFF $157.78. NOW $160.20 IS THE REAL TEST.
Buyers are fighting back, but the 15-minute trend hasn't turned yet.
Above $160.20 → $161.20–$161.60 in play.
Rejected here → $157.78 back in focus.
Breakout or another bull trap?

$TICKER BOUNCED OFF $157.78. NOW $160.20 IS THE REAL TEST.
Buyers are fighting back, but the 15-minute trend hasn't turned yet.
Above $160.20 → $161.20–$161.60 in play.
Rejected here → $157.78 back in focus.
Breakout or another bull trap?
$CRWV DOWN 4% PREMARKET. HERE'S THE REAL TEST.
Buyers bounced it off $57.78, but $58.95 is still overhead.
Above $58.95 → $59.40–$59.55.
Lose $57.78 → sellers stay in control.
I'm watching this setup into the open.
Bounce or bull trap?

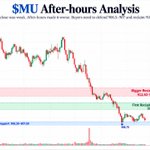
After-hours $MU
The close looked strong. The after-hours tape is telling a different story.
MU closed around $931.24, but the post-market move couldn’t hold the highs. Price pushed near $932, then sellers took over and walked it back down toward $922.50.
That shift matters more than the headline gain.
$922-$923 → first support
Hold above it → buyers still have a chance to stabilize the fade.
Lose it → $919-$920 becomes the next area I’m watching.
$925-$926 → first reclaim zone
Get back above it and the tape starts looking healthier.
$929-$932 → major resistance
Break and hold → buyers regain control.
Reject again → sellers probably keep leaning on the move.
The regular session showed strength.
The after-hours action showed where supply is still sitting.
Tomorrow, I’m watching whether buyers can defend the low $920s or whether this turns into a deeper unwind.
Most traders watch the close. I care more about what price does after everyone thinks the move is over.
$MU $NVDA $SOXX
I mainly post real-time market setups, key levels, and price action during the session. If you like following what actually matters on the chart, feel free to follow along.

Intraday $MU
The morning squeeze already happened.
Now I’m watching whether buyers can actually defend the breakout instead of giving the whole move back.
MU ripped from the high $870s into $922.28, then sellers hit the move hard. Since then, price has been compressing around $911-$912 instead of fully breaking down.
That makes this the fight right now.
$910-$911 → immediate support
Hold it and buyers keep the intraday structure alive.
$907-$908 → next support
Lose that and the pullback starts looking a lot less controlled.
$914-$915 → first reclaim zone
Get back above it and buyers start forcing the issue again.
$918-$922 → bigger resistance
That’s where sellers showed they’re willing to defend.
Volume has cooled off after the morning move, so I care more about whether price can hold these levels than another quick spike.
The rally got attention.
The hold is what matters now.
Can MU defend $910 and take another shot higher, or do sellers finally turn this into a deeper unwind?
$MU $NVDA $SOXX
I mainly post real-time market setups, key levels, and price action during the session. If you like following what actually matters on the chart, feel free to follow along.

Pre-market $MU
The headline is the gap down.
The real question is whether buyers can keep defending the lows.
MU is trading around $872.20 pre-market after yesterday’s weak close, but the overnight action has been much more violent than the current price suggests.
Price flushed all the way to $863.40, bounced hard into $880, and has since rolled back into the low $870s.
That puts the fight here:
$871-$872 → immediate support
Hold it and buyers still have a shot at stabilizing the pre-market range.
$868-$869 → next downside area
Lose that and the overnight low starts coming back into focus.
$875-$876 → first reclaim zone
Get back above it and buyers start repairing some of the damage.
$879-$880 → major resistance
That’s where the overnight bounce already failed.
The volatility is obvious. What matters now is whether buyers can actually defend a level instead of just producing another quick bounce.
Can MU build a base above $871, or does this turn into another lower-high setup before the open?
$MU $NVDA $SOXX
I mainly post real-time market setups, key levels, and price action during the session. If you like following what actually matters on the chart, feel free to follow along.

After-hours $MU
The close was weak. The after-hours reaction made it worse.
MU spent the afternoon printing lower highs and lower lows, then sellers kept pressing after the bell. Price slipped from the $914 close area down toward $906.70 before trying to stabilize.
That tells me the important story isn’t the size of the drop.
It’s that buyers still haven’t shown they can hold a bounce.
$906.50-$907 → immediate support
Hold it → buyers at least get a chance to build a floor.
$910-$911 → first reclaim area
Get back above it and the tape starts looking less heavy.
$912.50-$914 → bigger resistance
That’s where sellers are most likely to test any recovery.
The structure is still simple: lower highs, lower lows, and every bounce keeps getting sold.
Tomorrow I’m not watching for a green candle.
I’m watching whether buyers can finally defend one.
Can $907 hold, or does MU keep searching for a lower floor?
$MU $NVDA $SOXX
I mainly post real-time market setups, key levels, and price action during the session. If you like following what actually matters on the chart, feel free to follow along.

Pre-market $MU
I mainly post real-time market setups, key levels, and price action during the session. If you like following what actually matters on the chart, feel free to follow along.
The drop isn’t what I’m watching anymore.
I’m watching whether buyers can finally build a floor.
MU got hit hard from the upper $970s, flushed all the way to roughly $929, then bounced — but every recovery attempt has struggled to hold.
This morning price is back around $940.70, sitting near the lower end of the recent range.
That puts the fight here:
$939-$940 → first support
Hold it and buyers still have a chance to stabilize the tape.
$935-$936 → next support
Lose that and the $929-$932 low zone comes back into play.
$944-$946 → first reclaim area
That’s where I want to see whether buyers can actually hold a bounce instead of getting faded again.
$951-$953 → bigger resistance
Above there, the structure starts looking a lot healthier.
The chart doesn’t need another quick green candle.
It needs buyers to prove they can defend one.
Can MU build a base around $940, or do sellers keep pressing every bounce?
$MU $NVDA $SOXX
Intraday $MU
This isn’t a dip buyers are controlling right now.
MU has been printing lower highs all session, and every bounce keeps getting sold. Price just flushed to a fresh intraday low around $919.57 before trying to stabilize near $922.
That makes this area the fight.
$919.50-$920 → immediate support
Hold it and buyers at least get a chance to build a floor.
$924-$926 → first reclaim zone
Until MU gets back above there and holds, sellers still have control.
$930-$932 → bigger test
That’s where the structure starts looking less broken.
The earlier $940 area mattered. It’s gone now. I’m not interested in pretending the old level still controls the trade.
Right now the tape is simple: lower highs, lower lows, and sellers pressing every failed bounce.
Can buyers defend $920 and finally hold a recovery, or is the next bounce just another one to fade?
$MU $NVDA $SOXX
I mainly post real-time market setups, key levels, and price action during the session. If you like following what actually matters on the chart, feel free to follow along.
