

Crypto Markets Through a Smart Money Lens Intraday Setups Macro Analysis Market Structure BTC | ETH & Altcoin Analysis
Joined July 2026
- Tweets1.8K
- Following171
- Followers7.9K
- Likes20.5K
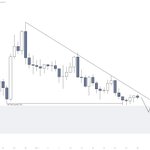


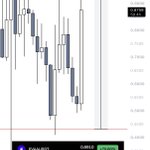


$ONDO - Getting ready for a monthly launch🚀
Guys, I’m continuing to accumulate this position at these levels. You know my target: 1.170$
Also, remember the limit order at 0.3781$ This could be the last opportunity!
220% upside potential!


$ONDO - What’s Next⁉️
Step-by-step guide:
So, since the moment I published my analysis, we’ve already moved +60% to the upside and broken through this long-awaited triangle. Here’s what you need to do next:
If your entry is below 0.3510$ you can confidently take 25% of your position off the table. Move your stop-loss to breakeven and leave the rest of the position open until the final take-profit at 1.17$
If your average entry is between 0.3510$ and 0.4020$ you can take only 10–15% of your position off the table and move your stop-loss behind the order block at 0.3300$
Also, if you’re planning to add to your position, you can place buy orders at 0.4350$ and 0.3870$ I’m not 100% sure the price will drop to these levels, but these limit orders won’t hurt!
That’s all from me for now. If you found this useful and interesting, I’d appreciate your support❤️

$ENA - Important!
You all know that for the past few weeks, I’ve been expecting the price to reach 0.1700$, but it keeps bouncing and moving higher without reaching this target.
For now, my plan remains unchanged. If we get a manipulation around the FOMC meeting, there is a chance we could reach this zone.
After that, it’s very simple. Buy at 0.1700$ and sell at 0.3028$. I think this move will happen quite quickly.
What’s your plan for ENA?

$ENA
Price broke the structure but failed to reach the 0.1700$ level by just 0.44 cents.
I think we’re heading up from current levels.
Targets remain valid🚀


Today is the FOMC meeting, and the market has already priced in the move. But where will the price go next?
If you look at history, you’ll understand a simple pattern. Last time, everyone expected a rate hike, and because the market was already pricing it in, $BTC rallied from 76k$ to 88.300$
I actually talked about this before the FOMC meeting.
Right now, I’m expecting more or less the same scenario. As the data and Fed rhetoric come out, I expect to see a manipulation move and a fake move to the downside, followed by a crypto market rally on Thursday and Friday.


$NEAR - Important!
4 days until the new monthly candle opens. This is exactly where I’ll be watching for a manipulation.
Price has already partially tested the upper boundary of the I-FVG and reacted locally, but the 4.00$ zone remains valid for adding to a position if you missed the entry at 1.50$
Targets remain unchanged: 7$ and 9$ mid-term, with a new ATH at 20$ in the long term.
Ohh, winter 2026/27 is going to be very interesting. Get ready!😁

$NEAR - SPOT🚨
Didn’t buy $NEAR at 1.5$ in August?
No worries, you’ll still have an interesting opportunity to accumulate a position in the 4.00$ - 3.600$ zone. This is a strong psychological zone for $NEAR
The 7$ and 9$ targets look very good in the medium term, while on a larger scale, I expect to see 20.597$ within the next 8–12 months!

GM Fam ☕️
Today is a key day for the entire financial market!
The Fed rate decision is coming, and the charts are waiting for the next catalyst.
My plan remains bullish. I believe much of the uncertainty is already reflected in price, and now we wait for the news to trigger the next move.
Stay focused. Don’t let volatility shake you out of your plan🚀
Tomorrow is a big day for crypto and the financial markets as a whole!
You know my plan. Tomorrow could be decisive. Be ready🚀
Have a great evening, everyone🫂

Guys, take a close look at these charts and tell me what you see!
$ENA $ONDO $ZEN $FET - Absolutely identical structures with massive liquidity building above and an average upside potential of 40–60% just to reach their previous highs.
I could attach a few more charts like these, but X only allows 4 screenshots, so let me explain what I’m trying to get across.
The US midterm elections are taking place in November. Charts never lie, and they are already pricing in this news. That’s why we’re seeing such massive liquidity build-ups. Most likely, DJ Trump already has solutions to all the ongoing crises on his desk and will announce them at the right moment, triggering the appropriate market reaction.
Falling oil prices $OIL a stronger dollar, and rising high-risk assets like $Altcoins Don’t let yourself be fooled. He’s manipulating the market very cleverly, but the charts show the move well before the news hits.
Just keep accumulating positions while you still have the opportunity, so you don’t end up buying the highs later and sitting through a -30% correction, as usually happens.


$ARB - Update!
Since the last analysis, price has moved lower and swept half of the liquidity, but the 0.1965$ zone continues to attract price and prevent it from moving lower.
As for position accumulation, this can be done across the entire range down to 0.1452$ in case of a manipulative move followed by a quick recovery.
The local high remains an interesting target at 0.2556$ which would provide a 75% upside move.
Mid-term, the target is the upper boundary of the range at 0.6247$ where I will take profits on the majority of the position.
From a global perspective, 1.2953$ looks like a logical target based on price rebalancing, so I’ll leave a small portion of the position for that zone.

$ARB
I think it will surprise many people very soon, as the price has formed liquidity both below and above.
When we move to sweep the liquidity below, everyone will start thinking that a crash has begun, and this is where things will get really interesting!
Inexperienced traders and beginners will start opening short positions, thinking the cycle is over and we’re heading lower, and the market will prepare a new high as a gift🚀

$SUI
Well guys, a reversal is getting closer!
Price has now reached our zone of interest, making this an interesting area to accumulate a position for the next move up.
The mid-term target remains at 2.024$ while the long-term target stays at 5.5$ No changes.

$SUI - Very strong chart, so you should not overlook it🚨
The zone of interest is located at 1.060$ - 0.9815$ From here, I expect a reaction and continuation of the uptrend!
Main target: 2.025$ and once we break and hold above it, we will open the way towards 5.30$ from a more global perspective!

$EVAA - Woow, did it finally wake up?
+113% in just minutes🚀

$EVAA - THE NEW $AKE ⁉️
After looking at the monthly chart, I noticed almost identical patterns between these two charts, and EVAA is significantly lagging behind AKE.
If EVAA follows the same scenario, the upside could be insane - at least +3360% (33x) which could turn this token into the next hype.
I believe this scenario has a real chance of playing out, and we could soon see another rocket!


OIL - What comes next?
Let’s look at the facts.
EIA expects Brent crude to average 87$ in Q2 2027 and 74$ in Q4 2027 as supply gradually recovers and global inventories begin to rebuild.
At the same time, IEA forecasts global oil demand to fall by 2.6M barrels per day in 2026, with a partial recovery expected in 2027
Current oil prices are being supported by supply disruptions and geopolitical risk. But as production recovers, shipping routes normalize and inventories start building again, the pressure on prices could shift to the downside.
EIA forecasts global inventories to build significantly throughout 2027 This is one of the key factors behind its bearish outlook for oil.
The main risk to this scenario remains the conflict in the Middle East. Any further escalation could delay the recovery in supply and keep prices elevated for longer.
If the bearish scenario plays out, easing energy-driven inflation could support a more favorable environment for risk assets, including $BTC and $Altcoins
I’m currently holding an open short position on $OIL targeting a move down to 65.335$ per barrel, which would represent a potential downside of around 35%


LAR retweeted
Guys, take a close look at these charts and tell me what you see!
$ENA $ONDO $ZEN $FET - Absolutely identical structures with massive liquidity building above and an average upside potential of 40–60% just to reach their previous highs.
I could attach a few more charts like these, but X only allows 4 screenshots, so let me explain what I’m trying to get across.
The US midterm elections are taking place in November. Charts never lie, and they are already pricing in this news. That’s why we’re seeing such massive liquidity build-ups. Most likely, DJ Trump already has solutions to all the ongoing crises on his desk and will announce them at the right moment, triggering the appropriate market reaction.
Falling oil prices $OIL a stronger dollar, and rising high-risk assets like $Altcoins Don’t let yourself be fooled. He’s manipulating the market very cleverly, but the charts show the move well before the news hits.
Just keep accumulating positions while you still have the opportunity, so you don’t end up buying the highs later and sitting through a -30% correction, as usually happens.
$TAO - Price in the zone of interest!
After taking Sell Side Liquidity and partially filling the FVG, the asset is showing some strength, so be ready for a 60% move to the upside very soon!
As mentioned earlier, you can accumulate positions in the 248$ - 223$ zone, with targets at 374$ 420$ and a more long-term target at 750$
Strong chart. It just needs time to shake out the weak hands before moving higher!

$TAO - Looks great for a 60% mid-term move to the upside🚀
Expecting a Sell-Side Liquidity sweep and FVG fill, with a test of the FF level at 233.70$
The liquidity compression that has been forming for 26 days and the local high at 374.70$ are acting as magnets for price!

$STRK - The pullback is part of the plan
Let’s take a closer look at $STRK and see what could happen next!
In August, the price rose 350% from our entry at 0.03086$ to 0.1265$ in just 49 days, before experiencing a strong correction in October.
This is where most people start panicking, thinking that the price will fall even lower and that we will never reach 0.2795$ And this is where they make a big mistake.
The price needs this pullback because people who entered at 0.1260$ were expecting an even bigger rally. When the price drops to around 0.03735$, they will simply sell their positions instead of buying more. And we will be buying up the very coins they purchased at 0.1260$
It’s simple. This is classic ICT market psychology. After a strong rally, we often get a pullback before the uptrend continues. That’s why the setup remains fully valid!
Buy at 0.03735$ - Sell at 0.2795$ and secure a 707% profit!
It’s that simple 🤝

$STRK - What’s next?
After a significant move to the upside, the price experienced a correction, which is completely logical as it shakes out weak hands who opened positions at the highs.
For now, the setup remains fully valid, as my entry is at 0.03020$
However, there are two key zones from which we could continue moving up, as the main targets have not yet been reached.
0.05530$ and 0.03735$ are interesting zones to add to the position!
Key target: 0.2795$

$ETH - The key level to watch during this manipulation
During this manipulation, it is better to focus on $ETH and ETH/BTC as the picture here is much clearer and more straightforward.
2,255$ is a strong key RBS level formed on the monthly timeframe. This is exactly where it would make sense to see a structural low form.
While there is no precise level to focus on for $BTC use $ETH as your main reference.
Overall, the scenario remains the same. There is also a significant amount of liquidity that could act as a magnet for price.
After sweeping the 2,255$ level, the first target I will be watching is 2,430$ with potential continuation if price holds above that level and buyers show strength.

$BTC - One final shakeout before the rally?
The manipulation continues. At the beginning of the week, I said we would get one final manipulation before the move up.
Right now, you can see price trapped between liquidity pools. But what comes next?
The most logical scenario is a fake move to the downside to sweep liquidity and take out the stops of early longs, followed by a reversal pattern and a rapid move up before retail traders have a chance to buy back in at a good price.
The most interesting part is that this manipulation and squeeze could be quite aggressive, so be careful. We could potentially see 78.500$–76.800$
But also be prepared for the asset to get bought back up just as quickly, with the first target being BSL liquidity and the FVG around 82.045$
$ONDO
The limit order at 0.4278$ has already been triggered!
There is still one more good entry at 0.3781$ From this zone, we could potentially move higher!
Potential move: 213% with liquidity at 1.170$ to be taken!

$ONDO - WHAT’S NEXT⁉️
There is still around 190% upside potential left. Here is my step-by-step plan:
There are two Fibonacci levels within the OTE zone where I have placed limit buy orders. From this zone, I expect the next move to the upside!
Orders: 0.4278$ 0.3780$
After breaking to the upside, price is now gradually moving lower locally, but it remains strong and continues to accumulate liquidity.
The main target is to deliver price into the BSL liquidity zone at 1.170$
