

Christian + Dad + Lawyer. Philippians 2:5-11.
Larue, Texas
Joined June 2011
- Tweets634
- Following880
- Followers934
- Likes4.8K


Pinned Tweet
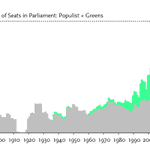
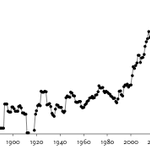
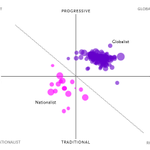
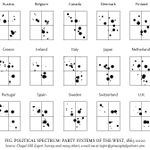
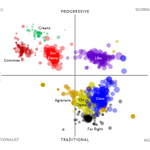
Coded every political party across all elections in advanced countries since 1868. Here are a few charts: 1) Vote shares across nine party families, average distribution.

For anyone looking to get lost in an adventure over the summer, I highly recommend Candice Millard's The River of Doubt—Roosevelt’s story of exploring an unknown Amazonian river. I'm about halfway finished and I can't put it down.

6
298
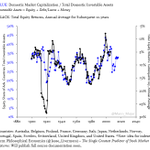
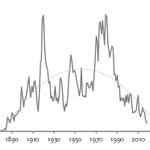
Applied Jesse Livermore's (@Jesse_Livermore) Average Equity Allocation concept to 15 other advanced countries (1870-2016). Results are preliminary, but thus far the correlation between equity share of investable assets and future returns are tight across time/countries.


11) Average position of majority parties/coalitions for all developed countries. Per this chart, we're exactly where we were a century-ago. Would expect to see tide to shift towards pro-labor from here.

1
1

Taylor Mann retweeted
Never in American history has technology displaced so few and scared so many. See chart: rate of occupational change (job churn) by decade, 1850 to 2015.

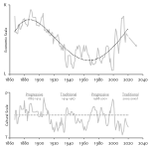
Prof. Mark Blyth and I teamed up w/ an AI firm to build a model that predicts when/why economic regimes break down and see what effects this has on politics. Would love to present findings at SXSW next year, but need your vote to make it happen. Thank you! shar.es/aXWY20
1


Upward mobility is highly correlated to family formation in adv. countries; I think these two variables feedback into one another: upwardly mobile generation produces large cohort that causes downward mobility, producing a smaller cohort leading to upward mobility.


No expert in Spanish politics, but think the main take-away from today's election is the continued rise in fragmentation and volatility. Attempted to put this into context: charts below show winning vote share and electoral volatility in Spanish elections (1876-1936, 1977-2019).


1
2
