

Charts with the odds on every level. Order flow, a plain-words backtester, forward tests and a trade journal in R. Start free: https://nitter.gq/t.co/bhnoopSED7
The Risk Lab
Joined October 2026
- Tweets34
- Following1
- Followers613
- Likes28


Pinned Tweet
1/
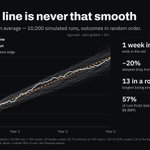
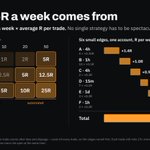
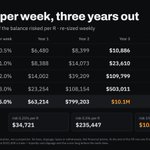
5R a week. A $5,000 account. Compounded for 3 years.
$10.1 million.
The same trades with a fixed $50 risk: $44,000.
That gap is compounding. Here's the math: what R means, what different R values turn into, and why automated strategies are how you'd actually chase it 🧵

What the crypto market actually does.
98 perpetual-futures coins since 2021, 10 million one-minute bars, six years of open interest and positioning, $4.9 billion of liquidations, all run through the lab's own tape.
1. The day has one loud hour, and every hour has a loud first minute.
Every 5-minute bar of the last two years across ten majors, measured against the coin's own typical bar. The quietest slot of the day is 05:55 UTC at 0.7×. Then 13:30 UTC (US data) at 1.6×, and 14:30 UTC, the US cash open, at 1.7×. One 90-minute block carries the day; 03:00 to 08:00 UTC runs at 0.85×.
The same shape repeats inside every hour. Minute :00 runs at 1.2× a typical minute, :30 at 1.2×, :15 and :45 at 1.1×, :59 at 0.8×. The clock itself moves price: bar closes, funding settlements, the orders people park on round times.
2. The day's extremes come at the open and in US hours, not at the close.
141,871 coin-days. The day's high prints in the first UTC hour 16.3% of the time, the low 14.0%. A random walk puts about 13% at each end (we simulated it), so the open is only mildly special. The real anomaly is the other end: a random walk puts 13% of highs in the last hour. The tape puts 7.6%. The crypto day does not finish at its extreme. It finishes quiet, and the extremes it prints away from the open come in US hours. Saturday runs at 0.8× a normal day's range, Sunday 0.9×, Monday 1.1×.
3. When the crowd is most long, the next week is the worst one.
The largest perp venue publishes its long/short account ratio. 1,908 days of it on BTC since September 2020. Accounts are net long on 79% of days, the median is 1.45 longs per short, and longs paid the funding on 74% of 8-hour settlements over the last 13 months.
When that ratio sits in its top decile (2.45 longs per short or more), the next seven days averaged −2.7%, up only 42% of the time. Bottom decile (0.78 or less): +1.7%, up 59%. A typical day: +0.7%, up 52%. The weeks overlap, so call it 25 independent looks per decile. A lean, not a law, but it has leaned the same way for six years.
4. Positions are built all day and forced out in two hours.
BTC open interest by hour, 17,743 hourly reads. It grows through every hour from 01:00 to 17:00 UTC, biggest adds at 14:00 and 15:00, and shrinks from 18:00 to 23:00, with −16 and −23 basis points an hour at 21:00 and 22:00. Positions open through Asia and Europe and close out of the US afternoon.
Liquidations are the mirror. 1.5 million forced closes on two venues over the last two months, $4.9 billion. The 15:00 UTC hour alone carries 13.2% of every dollar liquidated; 13:00 through 15:00 carry 29%. The quietest hour, 06:00, carries 1.7%. Longs were 55% of the money flushed.


A serious crypto trader's stack, at the tiers people actually buy. List prices, monthly:
TradingView Expert · charts · $199.95
Bookmap Global+ · order flow · $99
TraderSync Elite · journal · $79.95
TrendSpider Advanced · backtesting, alerts · $349
3Commas Expert · bots · $110
$838 a month.
And the expensive part isn't the subscriptions. It's that none of them know your rule, your journal, or each other.
Your chart can't test what you drew.
Your journal can't tell you which rule is bleeding.
Your backtester has no idea what happened after you went live.
Your bot runs a grid, not your edge.
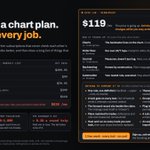
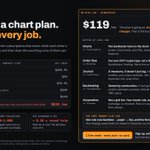
Risk Lab is $119 a month. Less than the chart plan alone. And it's better at each job:
HOW IT STACKS UP
• Charts: the backtester lives on the chart. Draw a level, test it, arm it, same screen. Auto levels, auto fibs, wave counts, TPO, Wyckoff, a 5-second footprint.
• Order flow: our own 24/7 crypto tape, not a feed we rent. Footprint, delta, open interest, liquidations, funding. Alerts fire on flow conditions, not just price.
• Journal: it measures, it doesn't just log. Heat and run on every trade from real candles, your stops replayed, rule cost in R, a bias lab, Monte Carlo. 20+ importers including prop firms.
• Backtesting: honest by construction. Plain-language recipes, 5 years of 5-minute history on 780+ pairs, pessimistic fills, nothing optimistic.
• Automation: your tested rule, executed. Stop attached at the exchange and re-checked. Runs on your machine with your keys. Paper first, always.
NOTHING TO COMPARE IT TO
No other product has a column for these.
• One rule, one definition, runs backtest → paper → live. No rewrite between stages.
• A luck gate on every test: out-of-sample verdict, attempts counted, sealed.
• The forward record sits beside the claim. The strategy seals itself or it doesn't.
• Plans matched to trades. Adherence and rule cost measured, not assumed.
• Heat and run on every trade you ever took, then your stops and exits replayed.
• Theses on a clock: prices stamped at post, sealed, scored by the tape.
• Groups with shared strategies and every member's forward record.
• Plug in your own model: it reads your journal and runs your tests through the lab.
• A Lab Assistant that knows every tool, and a manual with a recipe for every term.
• An export we can't read? We build the importer.
WHAT TRADING ALREADY COSTS YOU
One fitted strategy, traded 100 times before anyone checked it for luck: about 17R.
One prop evaluation: $100 to $1,000, paid again every time an unmeasured rule breaks.
The exchange's cut: roughly 0.1% a round trip, win or lose.
The lab takes none of that. Flat price, no cut of your fills.
THE FOUNDING PRICE
The price is going up.
Join before it does and yours never changes while you stay active. That's the thank-you for being a founding member of the lab.
Try the entire platform free for a week. No card.
Sign up, activate the free week from your account, go.
myrisklab.com

Risk Lab retweeted

Because you can connect your own a.i model directly into the Risk Lab now, you will be able to easily build and test the exact strategy you are looking for on 5 years of tape across hundreds of pairs, and run it as an automated strategy if you want.


Your trading model just got a lab.
Claude, ChatGPT and Grok now plug straight into Risk Lab: describe a setup in plain words and your model writes the strategy, checks it against the lab's own parser, and backtests it on years of real tape — ten variants in one call.
And the part nobody else does: the lab talks back honestly. Every result arrives with its out-of-sample verdict and your attempts count stapled to it. Iterating at machine speed gets priced as luck, exactly like hand runs — your model can't hand you a cherry-picked green number, because the warning ships inside the result.
Idea → tested → honest verdict, in minutes, inside the chat app you already use.


9/
That's what Risk Lab is built for: write a strategy, backtest it with a read on how much of the result is luck, let it paper trade itself, then run it live on your own exchange account.
Measure in R. Prove it forward. Then let it compound.
myrisklab.com

10/
Want to run your own numbers? The simulator and the position size calculator are free, no account needed:
myrisklab.com/simulator
myrisklab.com/tools/position…
Not financial advice. The math is the math; the edge is on you.
Risk Lab retweeted

Morning Folks!
Do you like the tools inside Risk Lab?
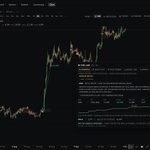
Because seriously… look at what’s being built into this platform. 👇🔥
Chart 1 ~ Gann Box
A fully integrated Gann Box with built-in support & resistance levels directly mapped onto price, by the way, we luanch at the end of this box. 😉
Chart 2 ~ Sun Planetary Lines + Gann Seasonality
Sun planetary lines projecting potential future price targets, support & resistance.
Then look at the bottom of the chart…
Gann seasonal dates incorporating the geometry of the calendar year, natural squares and trines ~ also lightly superimposed across the chart itself.
Chart 3 ~ Gann Master Chart of 144
One of Gann’s most powerful mathematical frameworks brought directly into the platform.
Chart 4 ~ This one is an absolute BEAST. 🤯
Sun planetary lines combined with Supply & Demand zones.
A stunning built-in ephemeris on the right displaying planetary aspects and natal transits.
Gann yearly divisions mapped directly onto the chart.
Moon phases across the bottom.
And then couple ALL of that with an Elliott Wave count checked against automatically calculated Elliott Wave rules and guidelinesbuilt within the Risk Labs software helping keep both you and your count on track.
And yet the structure remains very bullish. 👀
Gann.
Geometry.
Planetary cycles.
Seasonality.
Supply & Demand.
Elliott Wave.
Ephemeris data.
All inside ONE trading platform.
I mean…
Who doesn’t love Risk Lab? 😂🔥
And the craziest part?
@luckychartape is STILL building it.


Risk Lab retweeted

Why I love Risk Lab @Myrisklab ... it's a
✅ Community of goated chads
✅ Journaling and trade review software
✅ Charting, testing and planning tool
✅ Alert and automation system
✅ Much much more... see video for a tour 📈
Risk Lab retweeted
Folks!
I’m reposting this for anyone who may have missed my original post below.👇
I just have to say it again…
I’m completely blown away by what @luckychartape has created with "Risk Lab".
I know I’ve mentioned it a few times now, but seriously, if you could see what I’m seeing behind the scenes, your jaw would drop.
I’m STILL getting my head around everything this trading platform can do. It’s an absolute powerhouse.
And the crazy part?
Lucky is STILL building.
More tools. More data. More functionality. More ways to actually TEST whether what you think you know about the market is true.
The man doesn’t stop. I’m beginning to wonder if he even sleeps 😂
Just look at the data this thing is producing.
And then look at the second chart 👇
Those are my Gann SQ9 levels projected from the most recent low.
Watch how price interacts with the geometry:
90° ~ first harmonic resistance.
Then price launches straight through to 270°.
Pullback into 180°.
Then a double tap around 315°, helping define the current range.
And now we’re potentially setting up for the completion of one full 360° rotation around the geometry of the circle.
This is exactly why I love combining Gann with hard data. One gives me the geometric framework, and the other allows me to measure, test and validate what I’m actually seeing.
Now I’ll finish with this…
Whenever I read posts like this myself, I’m usually immediately suspicious because I HATE sales pitches.
So let me make something very clear:
Lucky doesn’t need your money.
And neither do I.
I’m sharing it because when I come across something I genuinely believe provides incredible value to serious traders, I’m going to talk about it.
The tools are there.
The data is there.
The ability to test your edge is there.
What you do with it is entirely up to you.
Take it or leave it.
Your trading.
Your edge.
Your choice.
But if you’re serious about proving what actually works rather than simply believing it works…
The "Risk Lab" is one hell of a beast. 🔥🔥


