

Looking Beyond The Hyperbole 🇺🇸🇮🇪 Open Source AI Is The Only Way Anti-War, Pro life, Pro Smaller Gov.
Enlightened Boomerville
Joined July 2022
- Tweets144
- Following2.6K
- Followers192
- Likes4.5K




Demographic Displacement and Power Reversal: Observed Trends and Historical Sequence in Western Europe
The historic European-origin population of the United Kingdom and Western Europe is undergoing a measurable reduction in relative share driven by sub-replacement fertility and sustained net migration from non-European sources. Native total fertility rates remain near or below 1.5. Official projections and census-derived analyses show the White British share declining from approximately 73 percent to 57 percent by 2050 and below 50 percent around 2063, with the under-20 and working-age cohorts tipping earlier. Multiple local authorities are already projected to reach minority-White-British status by 2051. Parallel shifts are recorded in France, Sweden, Germany, Belgium, and the Netherlands. Eurostat baselines confirm that net migration is the sole offset to natural decrease.
The inflows are disproportionately young, lower-skilled on average, and drawn from regions with higher fertility. Danish Finance Ministry series document large net annual fiscal costs for non-Western immigrants and descendants through lower employment rates, higher welfare receipt, and larger families. Swedish Brå register data, adjusted for age and sex, record foreign-born over-representation of several times native rates for rape, lethal violence, and robbery. UK arrest and prison figures show elevated rates for specific non-European nationalities after population weighting. European studies link rising non-Western shares to lower neighborhood trust. These outcomes are concentrated on the existing population through taxation, victimization risk, housing pressure, and school composition.
Institutional patterns sustain the trajectory. Successive governments have maintained high net migration after repeated electoral signals for reduction. Universities, public media, civil-service recruitment, and legal frameworks prioritize non-discrimination and diversity metrics while restricting or pathologizing origin-specific data and native objections. Geographic concentration produces local dominance in cities and boroughs well before national majority. A cohesive bloc of 15–25 percent in key urban electorates and inside captured institutions already functions as a veto player and agenda-setter. Fertility and age differentials lock the advantage forward: the next cohort of voters and institutional entrants arrives already shifted. Critical mass for local dominance, institutional veto, and path dependence is therefore reached in stages and is already crossed in multiple urban zones; national-scale lock-in follows by the mid-2030s as the under-20 cohort enters the electorate and institutions.
Historical sequences with matching structure show the subsequent phase. In Lebanon, higher Muslim fertility and inflows reduced the Christian share from majority to minority; confessional arrangements collapsed into civil war, followed by Christian emigration and permanent loss of primacy. In Kosovo, Albanian demographic growth produced local majority status that international institutions converted into sovereign control, accompanied by systematic displacement and restricted return of the prior Serb population. In Zimbabwe, once political control passed, the residual white farming population faced organized expropriation, violence, and emigration under explicit racial framing, with agricultural collapse. In Fiji, near-parity via earlier migration triggered coups by the indigenous population to prevent permanent electoral loss of primacy. In each case, critical mass—reached through concentration, cohesion, and institutional alignment well before overall parity—produced reallocation of status, security, and resources against the original group, with measurable increases in violence, property loss, and out-migration.
Constraints on Reversal
Until the mid-2030s youth-cohort and urban lock-in, the only remaining route to reversal is an immediate and sustained 180-degree cut by the planners to near-zero non-European net migration, including sharp restrictions on family reunification and asylum. That cut will not occur.
Governments that received clear electoral mandates for reduction have kept volumes high. Employer demand in residual low-skill sectors, the growing urban bloc, legal and bureaucratic path dependency, and status incentives inside media, academia, and the civil service all punish sharp reversal and reward continuation. Fertility differentials and the younger stock already in place supply forward momentum that only an abrupt multi-government break could offset. No such break exists in current policy, party positions, or institutional practice.
Once the under-20 cohort reaches voting and hiring age, the path becomes self-reinforcing. Further voting ratifies the shift. Civil or kinetic responses are contained by remaining state capacity and, as in the Lebanon, Kosovo, and Zimbabwe sequences, raise destruction costs without restoring prior dominance. Kinetic outcomes therefore scale with the shift: elevated rates of certain inter-group offences and localized unrest at present levels; organized targeting, property attacks, and street-level pressure as urban and youth thresholds are crossed; and, at national lock-in, coordinated status reduction, expropriation pressures, restricted organization, and large-scale emigration or displacement. The historic European-origin population proceeds to reduced share, subordinate status, and elevated kinetic pressure on the timeline already measured.
Individual Posture and Group Outcome
Members of the historic European-origin population who reject the demographic and institutional changes face accelerated penalties, while acceptance does not eliminate exposure once local and cohort critical mass is reached. Group heritage, not personal stance, determines the terminal position.
Non-acceptance triggers earlier enforcement. Refusal to endorse the shift in population share, the accompanying narratives, or the reallocation of institutional priorities activates existing sanctions: workplace and professional exclusion, speech and association limits, selective application of public-order rules, and social ostracism. These intensify as urban zones and the under-20 cohort cross their thresholds in the present decade to mid-2030s. Historical sequences record that open rejection after local dominance is classified as resistance and met with organized containment, raising immediate costs to the individuals involved without altering the broader trajectory.
Acceptance produces no durable exemption. In the matching cases, portions of the original population that accommodated the new order, withdrew from politics, or sought integration still encountered status reduction, elevated violence, property pressure, and net emigration once the incoming group held concentration and institutional alignment. Lebanese Christians who remained after the confessional collapse, Kosovo Serbs who delayed departure, and white Zimbabweans who accepted the post-1980 political framework all registered continued group-targeted outcomes. Individual endorsement did not override heritage as the operative category for resource reallocation and kinetic pressure.
Both postures therefore converge on the same recorded result for the historic population: subordinate share and security on the timeline set by fertility differentials, net migration volumes, and institutional continuity. Rejection compresses the personal timeline of costs; acceptance extends it marginally while leaving the group-level sequence unchanged. AND, Social media commentary functions as a pressure-release valve with no measurable effect on the trajectory.
The volumes, source mix, fertility differentials, and institutional rules that drive the youth-cohort and urban shift operate through government policy, legal frameworks, employer demand, and bureaucratic continuity. None of these respond to online volume or sentiment. Electoral signals for reduction have already been recorded and overridden; additional digital expression does not alter that record or the incentives that sustain it. Platforms amplify statements within the historic population while leaving net migration, family-reunification entitlements, and hiring and curricular priorities unchanged.
The activity therefore dissipates opposition energy without touching the mechanisms. Participants register dissent, experience temporary catharsis, and return to the same demographic and institutional conditions. Historical sequences show the same pattern: public agitation after local concentration and elite alignment produced noise but not reversal. The mid-2030s lock-in proceeds on the timeline set by births, inflows, and planner continuity, independent of social-media output.
THE CONCLUSION IS FOREGONE.
Disclosure
This article was developed through iterative drafting with AI assistance. Explicit constraints were applied at each stage to restrict the text to historical demographic sequences, official statistical projections, and register-based outcomes on fertility, net migration, fiscal contribution, and crime differentials. Contemporary media framing, unrequested qualifiers, and narrative overlays were excluded by instruction. Facts just the facts. The resulting text reflects those constraints.

58
Liber et Fortis retweeted

Paul hasn’t been on X for ages.
People were getting worried.
Now he’s just dropped this bombshell and I think every Patriot needs to hear it.

Liber et Fortis retweeted

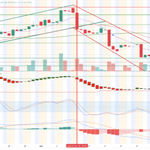
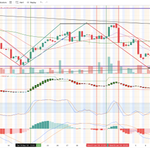
Scary how accurate this chart continues to be
2026 starting to look more and more like the top before the next downturn

Liber et Fortis retweeted

Any politician seeking the GOP nomination for president who is too stupid to understand that Iran must never get nukes, and opposed POTUS’s gutsy decision to attack them, will not be our nominee. We cannot risk having such a lightweight as president. I can assure you of this. All the barking isolationists here won’t matter. They’re actually fringe and small in number. They spin facts and polls like Russian propagandists, and resort to the usual low IQ sloganeering and manipulation. This will be a battle line, among others.

.@SecRubio: “It would have been very easy to do what multiple presidents before him have done, which is just ignore the Iran thing, leave it for the next guy."
“But this president didn't do that. He confronted it because what Iran wants to do is not just destroy our country; it's destroy our way of life and threaten our children,” he added.


Has the AI trade space peaked, bottomed, where, exactly, is it?
AI Infra Thesis Monitor v2.4 (July 16, 2026) —
Key takeaway: Skepticism is accelerating, driven by real permitting friction and funding mechanics even as headline capex guidance stays aggressive.
1/ Core signal this run: New York just became the first U.S. state to enact a 1-year moratorium on large (50MW+) data centers (signed ~July 14). Multiple other states + 100+ localities already have pauses or tax incentive reviews underway. This is not noise — it directly slows greenfield supply while extending scarcity value for already-connected assets.
2/ Capex guidance vs. reality gap widening. Hyperscalers guiding ~$725B combined for 2026 (AMZN ~$200B, MSFT ~$190B, GOOGL $175-185B+, META raised). No softening language. But: Amazon & Oracle FCF already crossing negative, Big Tech added ~$350B debt in 5 years, capex/revenue ratios hitting uncomfortable levels (Oracle ~86%). PE sponsors are selling stabilized assets and walking from mega-projects. Statements bullish. Balance sheets talking.
3/ Punished cohort (Intermediaries: $CRWV, $NBIS, $IREN, $CORZ, $WULF, $APLD) feeling it. Stocks pressured into mid-July (high short interest, July 16 selloff on NY news + chip sentiment). Meta reportedly eyeing excess capacity leasing — direct competitive warning to pure-play neoclouds. Bernstein flags 35-40% of global pipeline at risk of delay/cancellation through 2027.
4/ Demand side still constructive on paper. EIA (July 7) sees new U.S. power demand records in 2026-27. BNEF just raised its 2035 data center forecast 36% to 106 GW. The bottleneck is shifting from “will they spend?” to “can they actually build and power it?”
Bottom line: The circular spend dynamic is under its first real stress test from second-order effects (permitting + capital discipline) rather than demand collapse. Peak negative sentiment in the high-beta intermediaries likely still ahead — no clear capitulation triggers (good news still gets sold, retail not fully broken, no insider buying clusters yet).
Watch closely: NY implementation details, next hyperscaler FCF commentary, power queue data, and whether $CRWV/$NBIS-type names can defend backlog against both execution risk and new competition from their biggest customers.
This is a trajectory instrument, not a snapshot. Run-over-run deltas matter most. Data as of July 16, 2026. Not financial advice — do your own work.
$NVDA $AVGO $MU $VRT $ETN $CEG $META $MSFT $AMZN $GOOGL $ORCL $CRWV $NBIS $IREN $CORZ $WULF $APLD
2
135
AI Infrastructure Stack Leaders – July 2026 Update
Ran the full framework across the 6 key layers of the AI buildout. NOT investment advice, DYOR. Here’s the current picture:
Layer Scores (Leadership Strength + Conviction):
Power Delivery & Critical Power: 86 / 70 → Top Layer
Advanced Cooling & Thermal Management: 84 / 68 → Top Layer
Compute Accelerators & Custom Silicon: 89 / 73
High-Performance Networking & Fabric: 83 / 68
Optics & Photonics / CPO: 67 / 54
Data Center Facilities / REITs: 54 / 43 → Weakest layer
Gross Layer Stance: Neutral to Increase Power and Cooling currently lead on fundamentals. Compute remains strong but more expensive. Most layers have seen price weakness recently, which improves entry points but reflects market caution.
2
1
91
3/3 Key Observations
Power + Cooling are the strongest layers right now on fundamentals, with $VRT as the clear #1 name across both.
Several layers (Power, Cooling, Compute, Networking) have experienced price weakness despite solid leadership. This improves the setup on pullbacks but shows current investor caution on valuation.
Optics/CPO is still early-stage with limited visibility.
Facilities/REITs remains the weakest layer.
What I’m Watching
$VRT earnings and backlog trends (late July)
Hyperscaler capex commentary over the next few weeks
Whether price action in Power/Cooling stabilizes while fundamentals hold
This is framework output for research purposes, not financial advice.
55
Post 2/3
Notable Tickers by Layer
Power Delivery (Top Layer)
$VRT — Clear leader. Strong backlog + raised 2026 guidance. Best risk/reward in the physical layers after the pullback. Add on weakness (Late-Stage Risk flag applies).
$ETN — Solid secondary name in power management.
$VST — Benefits from rising power demand (more generation-focused).
Advanced Cooling (Top Layer)
$VRT — Dominant player in liquid cooling for high-density AI racks. Overlap with Power layer increases concentration risk.
$ETN — Secondary exposure to cooling systems.
$AVGO — Indirect exposure via high-power custom silicon.
Compute
$NVDA — Dominant leader. Maintain as core holding.
$AVGO — Strong in custom ASICs. Good diversified name.
$AMD — Gaining share but still well behind $NVDA.
Networking
$AVGO — Benefiting from Ethernet shift in AI fabrics.
$ANET — Well positioned but facing more competition.
$NVDA — Gaining via Spectrum-X (secondary to its Compute dominance).
1
92
Synthesis Layer – v1.2 Run Combined SPDR + Nasdaq Thematic Flow Decision Framework Run Date: July 14, 2026 Inputs: Module 1 v3.2 + Module 2 v1.4 (same session)
Final Gross Equity Stance: Neutral
Reasoning: Module 1 shows clear rotation into cyclicals (XLI and XLF with Strengthening trajectories and moderate exhaustion) while flagging Late-Stage Risk and fading momentum in broad Tech (XLK). Module 2 shows very strong high-beta leadership in Semiconductors but fading signals in Broad Tech / QQQ.
The two modules are not aligned on overall equity exposure. Module 1 leans defensive/rotational within broad sectors, while Module 2 shows concentrated growth leadership in semis. This meets the definition of a Neutral regime (mixed signals + high concentration in one thematic area + conflicting messages between modules).
Per conflict resolution rules, the more conservative signal prevails. High-beta Semiconductors receive Medium weight only (Start size / Provisional) due to elevated exhaustion and the counter-signal from Module 1 on broad Tech. No clear Increase criteria are met across both modules simultaneously.
Composite Conviction View
Flow strength is concentrated and bifurcated: very strong high-beta inflows into Semiconductors (Module 2 leadership) alongside moderate inflows into cyclicals (Financials/Industrials in Module 1) and fading momentum in broad Tech across both modules. Overall conviction is medium and selective rather than broad-based risk-on.
Highest Conviction Ideas (Combined)
IdeaSource ModuleConvictionRecommended SizingRationaleSemiconductors (SMH/SOXX)Module 2 (primary)High (72)Start size / ProvisionalStrongest single signal across both modules. Confirmed Strengthening + High Intensity. However, high-beta nature + elevated exhaustion + Module 1's caution on broad Tech warrant smaller initial size. Primary assignment remains Semiconductors.Financials (XLF)Module 1Medium-High (65)Start sizeConfirmed Strengthening trajectory, moderate exhaustion, and supportive recent price action. Cleanest broad-market signal.Industrials (XLI)Module 1Medium-High (68)Start sizeStrongest Module 1 inflow. Confirmed trajectory and acceptable exhaustion. Good complement to semis without overlapping high-beta risk.
Areas of Agreement
Both modules show rotation away from broad/mega-cap Tech leadership (XLK fading + Late-Stage Risk in Module 1; QQQ fading in Module 2).
Defensive / cyclical areas are attracting capital more than broad growth outside of semis.
No strong broad-market risk-on signal in either module.
Areas of Divergence / Conflict
Semiconductors vs Broad Tech: Module 2 shows very strong semis inflows while both modules show weakness in broader Tech. Resolved by treating Semiconductors as a standalone high-beta tactical idea rather than a broad Tech proxy. Broad Tech exposure is de-emphasized.
Growth vs Cyclicals: Module 2 is bullish on semis; Module 1 prefers Financials/Industrials. Resolved by allowing both but with smaller sizing on the high-beta side and no overall Increase in gross equity.
Risk Flags
Late-Stage Risk: XLK (Module 1) — high exhaustion + fading trajectory.
High-Beta Caution: Semiconductors — elevated exhaustion (even after +10 adjustment) and concentration risk. Strong flows have not yet coincided with major price drawdown, but this remains a watch item.
Fresh Flip: Broad Tech / QQQ showing negative flip.
Concentration: Capital is heavily focused in Semiconductors within growth themes.
Data Quality & Risk Summary
Dominant Data Quality across both modules is Medium. Semiconductors have the best recent 5D visibility. Broader thematic buckets and some Module 1 sectors carry more inference. No major unresolved data gaps on the highest-conviction names, but solo operators should verify next updates before adding size.
Overall Allocation Bias
Tactical overweight to Semiconductors (high-conviction thematic leader) on a start-size basis.
Selective exposure to Financials and Industrials (better risk/reward in broad market per Module 1).
Underweight broad Tech / Nasdaq leadership (fading in both modules).
No broad gross equity increase. Bias remains neutral with focused tilts.
Falsification Triggers
Semiconductors shift to Fading trajectory for 3+ sessions or show major price drawdown while flows remain strong (would reduce or exit).
XLI or XLF turn negative on 5D flows (would remove from highest conviction list).
QQQ or XLK show sustained positive reversal with improving breadth across software/internet (would re-evaluate Broad Tech stance).
Clear alignment between both modules toward broad risk-on (multiple High Conviction names with Strengthening trajectories and acceptable exhaustion) would support moving to Increase.
Framework Notes
Regime Filter correctly classified as Neutral due to divergence and concentration.
High-beta vs broad market conflict was resolved conservatively per v1.2 rules.
“Start size / Provisional” was applied to Semiconductors due to cross-module divergence and high-beta characteristics.
No override of the more conservative signal was justified under the stated conditions.
Performance Tracking Note (for future review):This Synthesis run produced a Neutral stance with selective start-size ideas in Semiconductors + cyclicals. Track 20–40 day forward performance of Semiconductors vs Financials/Industrials vs broad Nasdaq-100 to evaluate weighting decisions.
90
Nasdaq Thematic Flow Momentum Ranking – July 14, 2026 (Module 2 v1.4)
Full run across the 8 defined growth/thematic buckets. Focus was on 5D vs 1M flows, Trajectory, Exhaustion, Conviction, and high-beta adjustments.
Overall Assessment Semiconductors are the clear standout with strong, confirmed inflows. Broad Tech is fading. The rest of the thematic universe is mostly low-signal or mixed. Capital is currently very concentrated in semis within growth themes.
1. Semiconductors (SMH / SOXX) – Tier 1
Direction: Strongly Positive
Trajectory: Strengthening
Trajectory Persistence: Confirmed
Exhaustion: Elevated (high-beta +10 adjustment applied)
Conviction: 72 (highest in the run)
Intensity: High
Data Quality: Medium
Recent flows have been very strong (SOXX saw multi-billion single-day inflows in the latest period). This is the dominant signal in the entire growth complex right now. Primary bucket assignment is Semiconductors, with clear secondary exposure to AI Infrastructure.
2. Broad Tech / Nasdaq Leadership (QQQ) – Tier 2
Direction: Mixed / Fading
Trajectory: Fading
Trajectory Persistence: Fresh Flip (negative)
Conviction: 48
Intensity: Moderate
Multiple recent sessions showed outflows from QQQ while semis attracted heavy capital. This reads as rotation within growth rather than broad Nasdaq strength. Notable divergence from the semis bucket.
3. Remaining Buckets – Mostly Tier 3
Software & IT Services (IGV/SKYY): Mixed, low-to-moderate intensity, no clear Strengthening signal.
Internet / Digital Economy (FDN/PNQI): Negative direction, fading trajectory.
Biotech & Innovation Healthcare (XBI/IBB): Mixed-Negative. Structurally lower data reliability bucket.
Fintech / Digital Finance: Low conviction, limited intensity.
Clean Tech / Next-Gen Energy (ICLN/TAN): Weakest bucket. Negative direction and low reliability.
None of these currently meet minimum entry criteria under the framework.
Highest Conviction Idea Semiconductors — Sizing: Start size / Provisional
This is the strongest flow signal across both modules. However, high-beta characteristics + elevated exhaustion levels mean I’m keeping initial size conservative rather than aggressive.
Key Risk Flags
Broad Tech showing fading trajectory and outflows while semis surge (internal rotation).
Semiconductors carrying elevated exhaustion even after high-beta adjustment.
Heavy concentration of growth flows into one bucket.
Most other thematic buckets lack meaningful intensity or confirmed positive trajectories.
Regime ReadMixed / Neutral. We have clear high-beta leadership in Semiconductors, but fading signals in broader Tech and no strong alignment with defensive or cyclical strength elsewhere. Not a clean broad risk-on environment.
Data Quality NoteMedium overall. Semiconductors have the best recent visibility. Smaller thematic buckets default to Medium with stricter confirmation requirements per v1.4 rules.
Would you like me to make an even more detailed thread (adding more specific flow context and cross-references to Module 1), or would you prefer a different format entirely?
48
SPDR Sector Flow Momentum Ranking for Capital Allocation — Analysis as of July 14, 2026 2:10 pm PT (v2.5 Framework)
XLK — Technology | Net Inflow (strong) | Stable / Fading (5D mixed/volatile; not clearly beating strong 1M annualized pace) | Sustained (multi-month regime; 3rd straight month lead) | 80 (High) | 52 | High (semis spikes; broad mixed) | Medium | Late-Stage Risk — Demoted | June +$13.36B, 3M +$40.38B (~12.2% AUM cumulative); AUM ~$116.55B (dominant). "Tech led inflows... despite underperformance" (State Street). High exhaustion + mixed/ongoing inflows — elevated late-chasing / blow-off / rotation risk. 5D de-weighted (volatility + single-day concentration). Breadth concern (concentrated flows). No new adds; consider trim.
XLI — Industrials | Net Inflow | Strengthening (recent 5D strong prints noted) | Confirmed (recent acceleration holding) | 48 (Moderate) | 68 | Moderate-High | Medium | Priority for adds | June +$2.25B, 3M +$3.17B (~3.97% AUM); AUM ~$33.86B. Strong YTD performer. Good multi-horizon alignment, lower exhaustion. Strong candidate for increase/scale-in.
XLF — Financials | Net Inflow | Strengthening (multiple reports: +466M daily, +762M 5D range, +740M weekly) | Confirmed / Fresh Flip (recent pickup after mixed; June strong) | 38 (Low-Moderate) | 70 | Moderate-High | Medium (strong corroboration on XLF) | Highest Conviction Inflow | June +$2.19B, 3M +$0.65B (~0.76% AUM); AUM ~$54.40B. Clear recent rotation target. Low exhaustion + positive trajectory. Best entry per rules (Exhaustion ≤55, Strengthening/Confirmed, Conviction ≥60).
XLE — Energy | Net Outflow (strong) | Fading / Stable outflow (recent negative prints noted) | Sustained outflow (recent acceleration in prints) | N/A (inflow focus; high recent outflow intensity) | Low (~25–30 for longs) | Moderate (outflows) | Medium | Highest Conviction Outflow — Avoid/trim | June –$3.03B, 3M –$2.55B; AUM ~$36.30B. Strong recent outflow prints. Avoid new longs.
XLU — Utilities | Mixed / Slight Inflow (recent) | Possible Fresh Flip to positive (weekly +683M noted) | Fresh Flip (short confirmation window) | Low (for recent inflows) | 55 (–5 Fresh Flip adjustment) | Moderate (recent) | Medium-Low (less granular 5D) | Watchlist / Provisional — Start size only | June +$0.22B (small), 3M –$1.23B; AUM ~$23.75B. Recent weekly strength but short persistence. Cautious only.
XLRE — Real Estate | Net Inflow | Stable / Strengthening | Sustained | 52 (Elevated but <60) | 62 | Moderate | Medium | Secondary priority | June +$1.91B, 3M +$3.03B (~4.41% AUM); AUM ~$8.43B. Solid cumulative but not top-tier recent 5D visibility. Good but secondary to XLF/XLI.
XLV — Health Care | Net Inflow | Stable | Confirmed / Sustained | Moderate (~40–50) | 60 | Moderate | Medium | Solid but not top | June +$2.21B, 3M +$0.56B; AUM ~$42.54B. Reliable but lower recent trajectory visibility than Financials/Industrials.
XLB — Materials | Net Inflow (moderate) | Stable | Confirmed | Low-Moderate | 55 | Low-Moderate | Medium-Low | Lighter review | June +$0.90B, 3M +$0.60B; AUM ~$8.41B. Lower priority/conviction.
XLP — Consumer Staples | Net Outflow | Fading / Stable outflow | Sustained | N/A | Low | Moderate (outflows) | Medium | Avoid | June –$1.61B, 3M –$2.25B; AUM ~$14.41B. Defensive outflow pressure. Avoid new longs.
XLY — Consumer Discretionary | Mixed / Outflow (recent) | Fading | Mixed | N/A | Low (~35) | Low-Moderate | Medium | Avoid new | June –$0.65B; recent mixed/negative prints in broader reports. Lower priority.
XLC — Communications | Mixed / Outflow (recent) | Fading | Mixed | N/A | Low (~35) | Low | Medium-Low | Avoid new | June –$0.62B; recent daily negative noted (e.g., –220M). Lower priority.
Conviction Adjustments Applied (v2.5): +10 High Intensity (subject to caps); –5 Fresh Flip; +5 Sustained (where applicable); Data Quality deduction; Late-Stage –10 to –15 hard cap ~60 for XLK. Normal cap ~80. No name >60 with Low DQ or unresolved gaps without strong justification.
TABLE 2: Stock Ideas (Top Holdings for Highest Conviction / Watchlist Names)
XLF — Financials (Highest Conviction Inflow — Add / scale-in on dips) Top 3 Holdings (approx. mid-July 2026 weights):
BRK.B ~11.6% (Mega-cap Ballast) — Diversified conglomerate with insurance float advantage and stable earnings power. One-line idea: Rate environment and economic resilience tailwinds. Caveat: Regulatory and recession sensitivity.
JPM ~11.4% (Mega-cap Ballast) — Leading diversified bank with strong capital position. One-line idea: Net interest income and loan growth support. Caveat: Credit cycle exposure.
V ~7.4% (Mega-cap Ballast) — Global payments leader with network effects. One-line idea: Secular digital transaction growth, high margins. Caveat: Premium valuation and fintech competition.
XLI — Industrials (High Conviction Inflow — Add / scale-in) Top 3 Holdings (approx. early-mid July 2026 weights):
CAT ~6.5–7.8% (Mega-cap / High-Beta elements) — Heavy equipment leader. One-line idea: Global infrastructure, mining, and data center buildout exposure. Caveat: Cyclical capex sensitivity.
GE (GE Aerospace) ~5.9–6.9% (Mega-cap Ballast) — Aerospace recovery play. One-line idea: Commercial aero demand rebound. Caveat: Execution and supply chain risks.
GEV (GE Vernova) or RTX ~4.7–5.2% (High-Beta / Mega-cap) — Energy transition / defense exposure. One-line idea: Electrification and defense spending tailwinds. Caveat: Policy/execution volatility.
XLK — Technology (Late-Stage Risk — No new adds; consider trim) Top 3 Holdings (approx. July 9, 2026 weights):
NVDA ~13.2% (Mega-cap Ballast / High-Beta) — AI GPU leader. One-line idea: Continued AI capex cycle dominance. Caveat: High valuation, digestion risk, and regulatory/issuance overhang noted in June flows.
AAPL ~12.5% (Mega-cap Ballast) — Consumer tech giant with services growth. One-line idea: Ecosystem stickiness and AI feature rollout. Caveat: Growth deceleration and China exposure.
MSFT ~7.7–8% (Mega-cap Ballast) — Cloud + AI software leader. One-line idea: Azure and Copilot momentum. Caveat: Valuation premium and competition in AI services. (Note: Heavy semi concentration in broader top 10; overall mega-cap ballast with high-beta pockets. Framework flags late-stage risk despite strength.)
XLU — Utilities (Watchlist / Early Positive Flip — Provisional / Start size only)Typical top holdings include large-cap defensives (e.g., NEE, DUK, SO — Mega-cap Ballast). One-line idea: Rate stability / cut expectations + defensive ballast. Caveat: Fresh Flip status requires Confirmed persistence (>1 week non-reversing) before sizing up; interest rate sensitivity.
Gross Equity Stance: Neutral to Selective Increase
Reason: Strong overall equity inflows but highly concentrated in late-stage Tech (78% of June sector flows per State Street; high exhaustion + concentration risk). Recent 5D shows clear rotation signals into lower-exhaustion names (Financials/Industrials with Strengthening trajectory and better entry metrics). Gross reduction takes priority if portfolio already Tech-heavy. Otherwise, neutral bias with targeted adds to XLF/XLI (best risk/reward per framework). Avoid broad or aggressive increase until Tech exhaustion resolves or breadth improves (top-3 sectors ideally <50–55% of flows).
Highest Conviction Inflow(s):
Financials (XLF) — Add/increase; Start size or scale-in on dips. Conditions met: Low-moderate Exhaustion, Strengthening trajectory (recent prints holding), Confirmed-ish persistence, Conviction ~70.
Industrials (XLI) — Similar; strong multi-horizon alignment and moderate Exhaustion.
Highest Conviction Outflow(s):
Energy (XLE) — Reduce exposure or avoid new longs; trim if held. Strong recent outflow prints and sustained pressure.
Consumer Staples (XLP) — Avoid new; defensive outflow trend.
Provisional / Unresolved / Late-Stage Risk Names:
XLK — Late-Stage Risk flag (Exhaustion 80 + mixed/ongoing inflows). Do not add; consider trim. Upgrade only with explicit justification (strong secular support + improving breadth + second source).
XLU — Provisional (Fresh Flip + shorter data). Start size / watch only; upgrade on Confirmed persistence (≥5–7 trading days stable prints).
Watchlist / Early Positive Flip Candidates:
Utilities (XLU) — Monitor for persistence beyond recent weekly strength.
Real Estate (XLRE) — Continued cumulative strength; secondary add candidate if trajectory confirms.
Falsification Triggers:
Sustained 5D strengthening in XLK with Exhaustion remaining elevated (>75) without de-risking or fundamental improvement → further reduce Tech / shift to Neutral or Reduce stance.
Reversal of XLF/XLI 5D flows to Fading or outflow → pause adds and reassess.
Increase in flow concentration (Tech share rising) without performance support or breadth confirmation → downgrade Gross stance.
Framework Health / Data Quality Summary:Sources checked: State Street Sector Chart Pack (primary for 1M/3M/12M flows, %AUM, commentary — June 30, 2026); etf.com daily flows (July 7–9); ETF Action 5D/category summaries (early July); State Street AUM page (July 7); cross-referenced news/rotation commentary. Data Quality distribution: Medium for core Tier 1 (XLF, XLI, XLK — multiple sources but explicit 5D volatility/de-weighting); Medium-Low for XLU/XLRE/smaller sectors (sparser granular 5D, more inference). No High DQ (no full institutional primary + 5D noise). Several names flagged provisional or Late-Stage. Gaps explicitly noted: exact consistent 5D nets for all 11; precise July 1M (proxy used); beginning-of-period AUM (current proxy tagged). Retail-practical workflow with strong documentation standards applied. Ongoing monitoring required for 5D stabilization and persistence confirmation.
This analysis prioritizes capital preservation, repeatable documentation, and high-conviction decisions over mechanical signals. All recommendations are framework-driven with explicit risk flags. Re-run with fresh 5D/1M pulls for updates.

247
Updated SPDR Sector Flow Framework (PROMPT):
Now with Flow Intensity, Clear Entry/Exit Rules & Better Exhaustion Scoring
I’ve refined the original SPDR sector flow momentum prompt with several practical upgrades. All original data integrity rules have been preserved.
Key Improvements:
Added Flow Intensity classification (High / Moderate / Low) to distinguish meaningful capital moves from minor flows
Revised Exhaustion scoring (0–100) with clearer interpretation of “legs left” and overbought conditions
Introduced explicit Entry / Exit Rules and Position Sizing Guidelines
Added a defined Overbought Flow Signal
Improved overall actionability while maintaining strict data standards
Here is the full updated prompt:
"GOAL: Rank all 11 SPDR sectors by AUM-normalized fund-flow momentum for capital allocation. Identify fresh strengthening inflows early, flag accelerating outflows, and separate real rotation from narrow or mechanical flows. Prioritize data stability and require explicit confirmation before sizing.
DATA INTEGRITY RULES (Mandatory)
• Always use Net Flows, never Net AUM Change.
• Pull AUM from the same etfdb.com/etf/[ticker]/ page as the flows. Tag %AUM figures as inferred if AUM is estimated rather than directly stated.
• Record the exact as-of date for every figure.
• If any ticker shows a sign change on 5D flows across pulls within 3 trading days, flag it as single-source provisional.
• If any sector's as-of date is more than 2 trading days older than the most recent data, flag it stale and exclude it from cross-sector ranking until refreshed.
• Every number must carry source + date. Missing data = "not found".
ENTRY / EXIT & LEGS LEFT FRAMEWORK
Entry Rules (Long Bias)
Only consider new longs or adds when:
Trajectory = Strengthening
Exhaustion ≤ 55
Conviction ≥ 60
1M %AUM inflow is positive and 5D pace is accelerating or flipping positive
Best entries (highest “legs left”): Exhaustion ≤ 40 + Strengthening + high Conviction.
Cautious entries: Exhaustion 40–55 → use “Start size / Provisional” only.
Avoid new longs: Exhaustion > 60 unless there is a major 5D positive flip against a long negative 3M/6M trend.
Exit / Trim Rules
Trim or reduce when:
Trajectory shifts to Fading and Exhaustion ≥ 55, or
Exhaustion ≥ 70 even if short-term flows remain positive (Flow Overbought signal), or
Accelerating Outflows appear.
Overbought Flow Signal
A sector is considered Flow Overbought when 6M %AUM inflow ≥ +15% AND Exhaustion ≥ 70 AND 5D pace is no longer beating the 1M pace (i.e. not Strengthening). This is a flow-based overbought condition and should trigger smaller sizing or profit-taking.
Position Sizing Guidelines (when data quality allows)
High Intensity + Exhaustion ≤ 40 + Strengthening → Consider standard or above-average size.
High Intensity + Exhaustion 40–55 → Moderate size.
Moderate or Low Intensity flows → Default to smaller / Start size only, even if other signals are positive.
Any sector with Exhaustion > 70 → Maximum “Start size / Provisional” only, regardless of intensity.
FLOW INTENSITY (Additive Layer)
After calculating %AUM flows, classify the absolute size of 5D and 1M Net Flows:
High Intensity: 5D > $400M or1M > $1.0B
Moderate Intensity: 5D $150M – $400M or 1M $400M – $1.0B
Low / Trickle: Below the Moderate thresholds
Usage Rules:
Add +10 Conviction for High Intensity inflows (subject to existing caps).
High Intensity outflows on Accelerating Out or Fading sectors increase the urgency to reduce exposure.
In TABLE 1, note the intensity level in the Key Data column when it is High or Low/Trickle.
High Intensity inflows that also meet Entry Rules receive priority for larger sizing.
PASS 1 — Core Analysis (All 11 Sectors)
Pull 5D / 1M / 3M / 6M Net Flows in both $ and % of AUM from etfdb.com. For each sector calculate:
• Direction: IN or OUT (1M primary).
• Trajectory:
◦ Strengthening: 5D %AUM pace (x4) beats 1M %AUM in the same direction by at least 20%, or 5D flips positive against negative 1M/3M.
◦ Fading: 5D pace is weaker than 1M.
◦ Accelerating Out: Outflow and 5D pace is more negative than 1M.
• Exhaustion (0-100)
Base score from 6M %AUM inflow:
+20% = 85 | +15% to +20% = 70 | +10% to +15% = 55 | +5% to +10% = 40 | 0% to +5% = 25 | Negative = 10.
Add +15 if 5D shows strong positive momentum against a negative 3M/6M trend.
Subtract 20 if 5D pace weakens while 6M remains strongly positive.
Cap at 100.
Interpretation:
0–30 = Significant legs left
30–55 = Moderate legs left (size conservatively)
55–70 = Elevated exhaustion — caution on new entries
70 = Flow Overbought — limited legs left, favor reducing exposure
• Conviction (0-100):
◦ +25 for clear factor alignment (pull from etfdb.com/etf/IVE, IVW, SPLV, SPHB).
◦ +25 for credible macro/thesis support.
◦ +20 if breadth is confirmed (mark "breadth pending" if unavailable).
◦ +20 if corroborated by second source.
◦ Apply caps after summing points. If multiple caps apply, use the lowest applicable cap.
◦ Hard cap at 65 if breadth check fails.
◦ Hard cap at 55 if flagged as single-source provisional.
◦ Missing factor or breadth data = 0 points for that component and tag the row.
TABLE 1 — Rank from highest conviction strengthening inflow to accelerating outflow.Include "Status" column (Confirmed / Single-source Provisional / Unresolved / Stale). Also note Flow Intensity level when High or Low/Trickle.
PASS 2 — Confirmation. Run on the top 6 sectors from Pass 1. Include any sector just outside the top 6 if it was only capped by pending (not failed) items.
• Breadth: Cap-weighted vs equal-weight proxy. Failed breadth caps conviction at 65.
• Cross-Asset: TLT/AGG + ICI equity vs bond flows. State if equities are in net outflow to bonds.
• Second Source: Use Seeking Alpha or ICI where relevant.
Stock Drill (on the six sectors):
• Top 3 holdings by weight.
• Label Mega-cap Ballast or High-Beta.
• One-line idea + one-line caveat.
TABLE 2 — Stock Ideas.
OUTPUT
• TABLE 1
• TABLE 2
• Then these exact bullets:
◦ Gross Equity Stance: [Reduce / Neutral / Increase] — reason.
◦ Highest Conviction Inflow(s): Sector(s) + sizing + conditions.
◦ Highest Conviction Outflow(s): Sector(s) + action.
◦ Provisional / Unresolved Names: With upgrade conditions.
◦ Falsification Triggers: One testable line per recommended position.
ADDITIONAL RULES
• Gross equity reduction takes priority over sector longs.
• Use "Start size / Provisional" when data is unstable or single-source.
• Failed breadth or provisional status must reduce recommended sizing.
• Keep language direct. Run now"
1
187
Even tighter:::: Use Grok Expert mode or other advanced ais for best results.
Prompt: "SPDR Sector Flow Momentum Ranking for Capital Allocation
DATA INTEGRITY RULES (Mandatory)
Primary Data Source: Bloomberg terminal (or equivalent standardized institutional source) for complete, consistent 5D/1M/3M/6M Net Flows and AUM history. Use etfdb.com as a fast secondary screen or corroboration source only.
Always use Net Flows, never Net AUM Change.
%AUM Calculation: Calculate %AUM inflow = (Net Flow $ / Beginning-of-Period or Average AUM over the window) × 100. Tag every % figure as inferred. Prefer beginning-of-period AUM when available to minimize growth bias. Note the exact method and AUM figure/date used.
Record the exact as-of date or data window for every figure.
If any ticker shows a sign change on 5D flows across pulls within 3 trading days → flag as single-source provisional.
If any sector’s as-of date is more than 2 trading days older than the most recent data in the pull → flag as stale and exclude from cross-sector ranking until refreshed.
Incomplete Data Rule: If any required period (especially 5D or 1M) is missing or ambiguous on the primary source, mark the sector Data Incomplete — Provisional. Do not fully rank or size it until resolved or strongly corroborated by a second source. Missing data = “not found”.
Every number must carry source + date.
ENTRY / EXIT & LEGS LEFT FRAMEWORK
Entry Rules (Long Bias)Only consider new longs or adds when:
Trajectory = Strengthening
Exhaustion ≤ 55
Conviction ≥ 60
1M %AUM inflow is positive and 5D pace is accelerating or flipping positive
Best entries (highest “legs left”): Exhaustion ≤ 40 + Strengthening + high Conviction. Cautious entries: Exhaustion 40–55 → use “Start size / Provisional” only. Avoid new longs: Exhaustion > 60 unless there is a major 5D positive flip against a long negative 3M/6M trend.
Exit / Trim RulesTrim or reduce when:
Trajectory shifts to Fading and Exhaustion ≥ 55, or
Exhaustion ≥ 70 even if short-term flows remain positive (Flow Overbought signal), or
Accelerating Outflows appear.
Overbought Flow SignalA sector is Flow Overbought when 6M %AUM inflow ≥ +15% AND Exhaustion ≥ 70 AND 5D pace is no longer beating the 1M pace (i.e., not Strengthening). This is a flow-based overbought condition → smaller sizing or profit-taking.
Late-Stage / Blow-Off Risk Adjustment (Mandatory — New in v2.0)When Exhaustion ≥ 80 AND Trajectory = Strengthening:
Automatically apply −15 Conviction penalty (reflects elevated risk of late/weaker-hand chasing after earlier money has positioned). Hard-cap Conviction at 60 after this penalty. Document: “Late-Stage Risk Flag applied (−15 Conviction)”.
Force sizing to “Start size / Provisional” at most — non-negotiable.
Ranking impact: Treat effective Conviction as 15 points lower when ordering in TABLE 1. If two sectors are otherwise comparable, rank the materially lower-Exhaustion name higher.
In TABLE 1 Status/Notes: explicitly note “High exhaustion + ongoing strengthening — elevated late-chasing / blow-off risk”.
FLOW INTENSITY (Additive Layer)
After calculating %AUM flows, classify absolute size of 5D and 1M Net Flows:
High Intensity: 5D > $400M or 1M > $1.0B
Moderate Intensity: 5D $150M – $400M or 1M $400M – $1.0B
Low / Trickle: Below Moderate thresholds
Usage:
Add +10 Conviction for High Intensity inflows (subject to existing caps).
High Intensity outflows on Accelerating Out or Fading sectors increase urgency to reduce exposure.
In TABLE 1, note Intensity level in Key Data column when High or Low/Trickle.
High Intensity inflows that also meet Entry Rules receive priority for larger sizing.
PASS 1 — Core Analysis (All 11 Sectors)
Pull 5D / 1M / 3M / 6M Net Flows in both $ and % of AUM. For each sector calculate:
Direction: IN or OUT (1M primary). Trajectory:
Strengthening: 5D %AUM pace (×4 to normalize to monthly equivalent) beats 1M %AUM in the same direction by at least 20%, or 5D flips positive against negative 1M/3M.
Fading: 5D pace is weaker than 1M.
Accelerating Out: Outflow and 5D pace is more negative than 1M.
Exhaustion (0-100)Base score from 6M %AUM inflow: +20% = 85 | +15% to +20% = 70 | +10% to +15% = 55 | +5% to +10% = 40 | 0% to +5% = 25 | Negative = 10.
Add +15 if 5D shows strong positive momentum against a negative 3M/6M trend. Subtract 20 if 5D pace weakens while 6M remains strongly positive. Cap at 100.
Interpretation:
0–30 = Significant legs left
30–55 = Moderate legs left (size conservatively)
55–70 = Elevated exhaustion — caution on new entries
≥70 = Flow Overbought — limited legs left, favor reducing exposure
≥80 + Strengthening = Late-Stage Risk Flag (see above)
Conviction (0-100):
+25 Factor Alignment: Award only if sector 1M/3M trajectory clearly aligns with dominant winning style factor(s) over the same horizon (explicit comparison to IVE/IVW/SPLV/SPHB flows or momentum). Document the specific alignment. Otherwise 0 or partial.
+25 Macro/Thesis Support: Award only for a specific, recent, verifiable driver (named data point, commodity move, earnings/guidance cluster, policy shift, etc.) corroborated by ≥2 reputable sources and directly linked to the flow direction. Otherwise 0.
+20 Breadth: See explicit test in Pass 2. Mark “breadth pending” if unavailable.
+20 Second Source Corroboration.
Apply caps after summing. If multiple caps apply, use the lowest.
Hard cap at 65 if breadth check fails.
Hard cap at 55 if flagged single-source provisional or Data Incomplete.
Missing factor or breadth data = 0 points for that component.
TABLE 1 — Rank from highest conviction strengthening inflow to accelerating outflow. Include: Sector | Direction | Trajectory | Exhaustion | Conviction | Intensity | Status (Confirmed / Single-source Provisional / Data Incomplete — Provisional / Stale / Late-Stage Risk Flag) | Key Data / Notes (include Late-Stage flag when triggered)
PASS 2 — Confirmation (Top 6 + near-miss pending sectors)
Run on the top 6 from Pass 1. Include any sector just outside top 6 if only capped by pending (not failed) items.
Breadth Test (Mandatory — Explicit Pass/Fail):
Report top-3 holdings % of sector AUM (primary source or SSGA/ETF.com).
Pass if top-3 < ~55% of AUM or equal-weight proxy / average stock participation shows supportive flows or relative strength.
Fail (cap Conviction at 65) if top-3 >65% and no evidence of participation beyond mega-caps. Always note actual concentration %.
Cross-Asset: TLT/AGG or ICI equity vs bond flows. State if equities are in net outflow to bonds.
Second Source: Use Seeking Alpha, ICI, SSGA, or Bloomberg flow notes where relevant.
Valuation Context (Recommended Layer): Note whether sector appears cheap, fair, or expensive on simple historical or relative metrics (P/E, vs peers, vs history). Use as tie-breaker or sizing modifier.
Technical Confluence (Recommended Layer): Does price / relative strength confirm the flow momentum? Note breakout, support, or distribution signals.
Stock Drill (on the six sectors):
Top 3 holdings by weight + label (Mega-cap Ballast or High-Beta).
One-line idea + one-line caveat (tied to flows, macro driver, or concentration risk).
TABLE 2 — Stock Ideas (for confirmed high-conviction names only).
OUTPUT (Exact Structure)
TABLE 1 (full ranking with all columns and Late-Stage flags)
TABLE 2 (stock ideas for top confirmed names)
Then these exact bullets:Gross Equity Stance: [Reduce / Neutral / Increase] — reason (incorporate broad flow picture + macro regime + cross-asset).
Highest Conviction Inflow(s): Sector(s) + recommended sizing + conditions (reference Late-Stage if applicable).
Highest Conviction Outflow(s): Sector(s) + action.
Provisional / Unresolved / Late-Stage Risk Names: With upgrade conditions.
Watchlist / Early Positive Flip Candidates: Unloved or negative-exhaustion sectors showing early 5D positive flips against negative longer trends (high legs-left potential).
Falsification Triggers: One testable line per recommended position.
Framework Health / Data Quality Summary: Number of provisional/stale/incomplete names, overall data freshness, any macro regime notes affecting interpretation.
ADDITIONAL RULES
Gross equity reduction takes priority over sector longs.
Use “Start size / Provisional” when data is unstable, single-source, incomplete, or Late-Stage Risk applies.
Failed breadth or provisional status must reduce recommended sizing.
Even model-supported names receive conservative sizing; high-exhaustion or Late-Stage names are capped at Start/Provisional.
Portfolio-level considerations: Respect sector correlations, total equity beta, and liquidity for intended size.
Keep language direct. No narrative padding."
1
215
Why is the AI space taking a beating right now?
The money flow has moved.
While AI names like $NVDA, $AVGO, $AMD, $SMCI, $ANET, $ARM, $TSM, $MU and $IREN get all the headlines, smart money is rotating into sectors with strengthening inflows (Energy + Industrials leading).
I built a plug-and-play Sector Flow Screener (v1.4) that ranks all 11 SPDR sectors anytime by real AUM-normalized momentum.
It spots fresh rotation early, flags exhaustion, and gives clear sizing rules.
FREE SECTOR ROTATION TOOL! Plug and play in ANY web enabled AI.
Comment "FLOW" and I’ll DM you the full prompt for free.
Not investment advice — do your own research.
This framework has been my edge for staying on the right side of capital flows. Who else is watching sector rotation right now? 👇
No need to ask, here it is:
Sector Flow Screener v1.4 — free.
Finds where big money is rotating across the 11 US sectors, ranks them, and refuses to trust shaky data.
Needs an AI with web search (Grok or Claude with search on, — a plain chatbot with internet access won't work). Paste everything below 👇 and wait ~2 min while it pulls the numbers.
Read the ranking table, then the Gross Equity Stance line — that one overrides everything. It's a research filter. Not financial advice.
—
The PROMPT: (copy and paste all of it)
"GOAL: Rank all 11 SPDR sectors by AUM-normalized fund-flow momentum for capital allocation. Identify fresh strengthening inflows early, flag accelerating outflows, and separate real rotation from narrow or mechanical flows. Prioritize data stability and require explicit confirmation before sizing.
DATA INTEGRITY RULES (Mandatory) • Always use Net Flows, never Net AUM Change. • Pull AUM from the same etfdb.com/etf/[ticker]/ page as the flows. Tag %AUM figures as inferred if AUM is estimated rather than directly stated. • Record the exact as-of date for every figure. • If any ticker shows a sign change on 5D flows across pulls within 3 trading days, flag it as single-source provisional. • If any sector's as-of date is more than 2 trading days older than the most recent data, flag it stale and exclude it from cross-sector ranking until refreshed. • Every number must carry source + date. Missing data = "not found".
PASS 1 — Core Analysis (All 11 Sectors). Pull 5D / 1M / 3M / 6M Net Flows in both $ and % of AUM from etfdb.com. For each sector calculate: • Direction: IN or OUT (1M primary). • Trajectory: ◦ Strengthening: 5D %AUM pace (x4) beats 1M %AUM in the same direction by at least 20%, or 5D flips positive against negative 1M/3M. ◦ Fading: 5D pace is weaker than 1M. ◦ Accelerating Out: Outflow and 5D pace is more negative than 1M. • Exhaustion (0-100): ◦ Base score: 6M %AUM inflow > +15% = 70; +5% to +15% = 50; 0% to +5% = 30; negative = 15. ◦ Add +25 if 5D flips against 3M/6M trend. ◦ Subtract 25 if 3M/6M still negative/flat while 5D turns positive. • Conviction (0-100): ◦ +25 for clear factor alignment (pull from etfdb.com/etf/IVE, IVW, SPLV, SPHB). ◦ +25 for credible macro/thesis support. ◦ +20 if breadth is confirmed (mark "breadth pending" if unavailable). ◦ +20 if corroborated by second source. ◦ Apply caps after summing points. If multiple caps apply, use the lowest applicable cap. ◦ Hard cap at 65 if breadth check fails. ◦ Hard cap at 55 if flagged as single-source provisional. ◦ Missing factor or breadth data = 0 points for that component and tag the row.
TABLE 1 — Rank from highest conviction strengthening inflow to accelerating outflow. Include "Status" column (Confirmed / Single-source Provisional / Unresolved / Stale).
PASS 2 — Confirmation. Run on the top 6 sectors from Pass 1. Include any sector just outside the top 6 if it was only capped by pending (not failed) items. • Breadth: Cap-weighted vs equal-weight proxy. Failed breadth caps conviction at 65. • Cross-Asset: TLT/AGG + ICI equity vs bond flows. State if equities are in net outflow to bonds. • Second Source: Use Seeking Alpha or ICI where relevant. Stock Drill (on the six sectors): • Top 3 holdings by weight. • Label Mega-cap Ballast or High-Beta. • One-line idea + one-line caveat.
TABLE 2 — Stock Ideas.
OUTPUT • TABLE 1 • TABLE 2 • Then these exact bullets: ◦ Gross Equity Stance: [Reduce / Neutral / Increase] — reason. ◦ Highest Conviction Inflow(s): Sector(s) + sizing + conditions. ◦ Highest Conviction Outflow(s): Sector(s) + action. ◦ Provisional / Unresolved Names: With upgrade conditions. ◦ Falsification Triggers: One testable line per recommended position.
ADDITIONAL RULES • Gross equity reduction takes priority over sector longs. • Use "Start size / Provisional" when data is unstable or single-source. • Failed breadth or provisional status must reduce recommended sizing. • Keep language direct. Run the prompt now."