

Chart any asset against any other: crypto, stocks, Pokémon cards, NFTs. Market cap or price, even pre-listing. Free to start ↓
Italy
Joined December 2025
- Tweets23
- Following30
- Followers14
- Likes11



Pinned Tweet
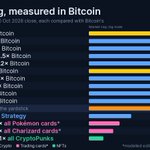
Everything, measured in Bitcoin.
Gold ≈ 18× Bitcoin. Apple and Nvidia ≈ 3.2× each. Tesla ≈ 1.0×.
Bitcoin ≈ 28× Strategy, 417× all Charizard cards and 1,811× all CryptoPunks.
Market caps at the 30 Oct close. A new comparison like this every day from today.
#Bitcoin

Up 76% in dollars, but what is this portfolio worth in gold? Bitcoin, Apple and a graded Pokémon card in one line, then one tap on Gold.
New guide: Crypto Market Cap vs Price — one number is nothing without the other.
$BTC at 90k sounds expensive. Altcoin at 0.001 sounds cheap. Market cap changes everything.
Supply, FDV, whats inflated.
omniachart.com/blog/crypto-m…
#OmniaChart

OmniaChart retweeted

New on the blog: overlay global M2 money supply on any chart.
BTC's biggest moves have landed within months of M2 expansion. Liquidity flows into risk assets when central banks print — and the overlay makes the pattern visible across any asset.
Works for stocks, crypto, commodities, gold. Pick an asset, add USM2 or global M2, see the correlation play out historically.
Full guide → omniachart.com/blog/m2-money…
#Bitcoin #M2MoneySupply #Liquidity #MacroAnalysis #OmniaChart

Weekly report is live 📊
7 cross-asset charts — AI crypto sector, Tesla vs SpaceX, SocialFi, and yes... Pokémon cards vs NVDA.
Full report → omniachart.com/report
#WeeklyReport #CrossAsset #OmniaChart #CryptoAnalysis
New on the OmniaChart blog: Sector Market Caps — track where smart money flows in real-time.
14 built-in crypto sectors + create your own custom groupings. See the full picture.
Read more → omniachart.com/blog/sector-m…
#OmniaChart #crypto #DeFi #sectors #marketcap
1/ Build a custom index in 30 seconds.
Pick any 5–50 assets. Combine them. Chart the result.
This is 16 NFT blue chips ($PUNKS $BAYC $AZUKI $MILADY $DOODLES + more) vs Pokémon total market cap.
One chart. Built in seconds.
#NFT #OmniaChart #crypto #CustomIndex #trading

OmniaChart retweeted
$WLD vs OpenAI FDV.
Peaked at 1:1. Now at 1/200 of OpenAI valuation.
This is what happens when the token issuance model doesn't match growth. But at some point — bottom forms, narrative restarts.
Watching for accumulation signs near current levels.
$WLD #WorldCoin #AI #crypto

$WLD peaked at 1:1 FDV vs OpenAI valuation.
Now less than 1/200 of OpenAI pre-IPO.
One of the only places you can chart crypto against private company valuations — before they list.
Try it → omniachart.com
$WLD #WorldCoin #OpenAI #crypto #AI

OmniaChart lets you compare $TSLA vs $NVDA by total market cap — not just price.
The ratio found support at 0.2. Could Tesla robotics and energy pivot restart the uptrend?
Only possible on @OmniaChart
#TSLA #NVDA #Tesla #Nvidia #crypto #trading #marketcap #OmniaChart

$BTC/$XAG market cap ratio hit exactly 1.0
The point where all Bitcoin = all Silver on Earth.
Retesting ascending channel support. Break above = new ATH.
Only @OmniaChart charts this.
omniachart.com
$BTC $XAG #Bitcoin #Silver #crypto #commodities

Rolex Submariner vs Gold market cap.
Luxury collectibles charted against commodities.
Wave 5 forming?
Only on OmniChart → omniachart.com

TradingView charts prices. OmniChart charts market caps.
Build custom indices from 1070+ assets in seconds. Compare funding-round data from before tokens even listed. Mix crypto, stocks, commodities, real estate — by market cap, not just price.
omniachart.io
Chart everything. Compare anything.
See what @b69ndmoon found — $ETH market cap tracking a Netflix-style growth pattern.
Only possible with cross-asset overlay on OmniChart.
nitter.gq/b69ndmoon/status/20321…

I've been watching $ETH's marketcap on a weekly, and there's an interesting pattern forming.
When you overlay a Netflix-style growth curve on the chart, ETH is tracking toward a ~$10 trillion marketcap within 3 years. Worth noting — that's a 4-6x from here depending on where we close this cycle.
The pattern isn't random. It's a convergence of:
• Historical ETH growth momentum
• Increasing institutional adoption (spot ETF, Shanghai upgrade momentum carry-over)
• DeFi + staking + L2 scaling narrative legs
Built this overlay on @omniachart because the tool makes it easy to test thesis-driven price targets with actual historical pattern fits.
Probability? I'd say 30-40% in a healthy macro environment, lower in recession. But worth tracking. 📊

OmniaChart retweeted
Chart 3: Robotics/$ETH ratio.
Held the 0.001 level for years. Sitting in accumulation zone with rising volume.
Descending resistance approaching. Breakout setup building.
Charted on @omniachart — only tool that compares crypto vs pre-IPO like this.

Robotics crypto vs pre-IPO robotics companies — charted for the first time.
15 tokens. 5 private companies. 3 charts. Only possible on OmniChart.
$IOTX $XRT $PEAQ $GEOD $ROBOT #FigureAI #Anduril #PhysicalIntelligence
omniachart.com
