

Winnipeg's community indicator system. Tracking progress. Inspiring action.
Winnipeg
Joined February 2012
- Tweets574
- Following480
- Followers543
- Likes267



Peg retweeted

Happy #EarthDay!
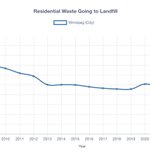
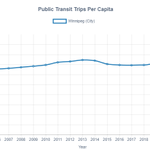
Did you know @PegIndicators tracks how Winnipeggers take action on climate-related issues? From commuting patterns & air quality to recycling to water use, this data helps us understand opportunities to tackle climate change in our city.
mypeg.ca/

Peg retweeted
It’s #EarthMonth—a reminder of how much our choices impact our planet.
Click to find out how @PegIndicators is measuring our city’s progress on environmental issues. Together, we can build a greener, healthier community for everyone who lives here!
mypeg.ca/

Peg retweeted
Annual building permit values in #Winnipeg (total residential and non-residential permit values) change over 20 years:
2001 – $372,969
2020 – $2,274,686
Data ➡️ mypeg.ca/indicator/buildingp…
#growth #building #wpg22 #construction

Peg retweeted
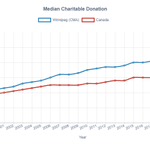
Thanks for giving, Winnipeg! We’re so grateful to be part of such a generous and compassionate community.
Special thanks to our donors and volunteers who make our work possible, and for the 125+ agencies and programs changing lives every day!

Peg retweeted
Poverty is a complex, stubborn problem—and it impacts 1 in 10 Winnipeggers.
Find out how our city is measuring our progress towards ending poverty in this report from @PegIndicators.
https://nitter.gq/t.co/ibRqvkxzSN

Peg retweeted
How is personal safety changing in #Winnipeg?
We’ve added 2021 data (by neighbourhood) on the number of assaults, homicides, sexual assaults or other sexual offences and other offences involving violence or causing death per 1,000 people. (1/2)
Data ➡️ mypeg.ca/indicator/personal-…

Peg retweeted
Kids in Seven Oaks are generally on track with physical health—but show weaker language skills than their peers from other neighbourhoods.
Measuring child development helps us understand our community’s needs. Learn more in this @PegIndicators report.
https://nitter.gq/t.co/ibRqvkx23f


Peg retweeted
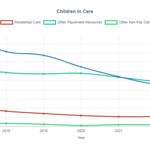
We have updated how we display data on Children in Care in #Winnipeg to include placement types as reported by the Manitoba Families Annual Reports.
Data ➡️ mypeg.ca/indicator/childreni…
#childrenincare #wpg22 #youth #SDGs #Manitoba


Peg retweeted
Youth obesity has risen in #Winnipeg
In the WRHA in 2019/2020, the percentage of youth (aged 12-17) who are obese or overweight (according to their BMI) was 33.4%. That’s significantly higher than the national average of 23.9%.
➡️ mypeg.ca/indicator/overweigh…
#health #youth #wpg22

Peg retweeted
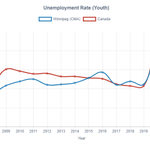
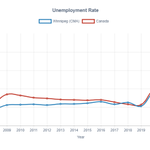
Youth unemployment soared in 2020 at the onset of the pandemic, up to 18.6% in #Winnipeg.
In 2021 (the most recent year we have stats for), that number fell to 14.1% or slightly above Canada’s national average.
➡️ mypeg.ca/indicator/youth-une…
#youth #jobs #wpg22 #unemployment

Peg retweeted
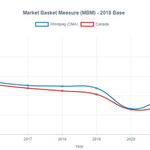
How have average home prices changed?
#Winnipeg #Canada
2008 – $196,940 2008 – $304,986
2021 – $349,753 2021 – $687,990
77.6% growth rate 125.6% growth rate
➡️ mypeg.ca/indicator/average-h…
#housing #wpg22 #inflation #realty #cdnecon


Peg retweeted
Happy #EarthDay!
Did you know @PegIndicators tracks how Winnipeggers take action on climate-related issues? From commuting patterns & air quality to recycling to water use, this data helps us understand opportunities to tackle climate change in our city.
mypeg.ca/

Peg retweeted
Poverty is a complex, stubborn problem—and it impacts 1 in 10 Winnipeggers.
Find out how our city is measuring our progress towards ending poverty in this report from @PegIndicators.
https://nitter.gq/t.co/ibRqvkx23f

Peg retweeted
It’s #EarthMonth—a reminder of how much our choices impact our planet.
Find out how @PegIndicators is measuring our city’s progress on environmental issues in this report. Together, we can build a greener, healthier community for everyone who lives here!
https://nitter.gq/t.co/ibRqvkx23f

Peg retweeted

Achieving the global #SDGs requires local action and local monitoring.
Winnipeg’s first Voluntary Local Reviews (VLRs) report shows how to close gaps between its local realities and the global implementation of the SDGs.
👉 Submit your VLRs report: https://nitter.gq/t.co/qC3jvTjsT9

ALT Text: Voluntary Local Reviews Report. Achieving the global SDGs requires local action and local monitoring. Winnipeg’s first Voluntary Local Reviews report shows how to close gaps between its local realities and the global implementation of the SDGs. bit.ly/VLRReportWinnipeg