

Day Trader and Outdoor Enthusiast, Sea Turtle Conservationist. Founder of “The Ocean Is Our Life” Futures Trader member of Victory Discord Community!
Tampa, Florida
Joined February 2009
- Tweets2.9K
- Following1.5K
- Followers623
- Likes5K




When you have finally “arrived” in your trading journey, this truly is THE last piece of the puzzle. Once you become fearless, when you know how to read price and execute, once you cross over to this new level of understanding, you find confidence in knowing you can trade your way back into the green no matter how red you go, it will become your “Achilles heal” if you don’t institute what JD is talking about in this video. I’ve been working on this, it’s my only hope of achieving the success I’ve given so much to find. Almost there…

Wow, I read this last night and followed YMs moves all night up against NQ and ES and then this morning as NQ started dropping at 10:00. Both NQ and ES were signaling short but YM wasn’t following. About 10:10 I could see that YM was about to show its hand and move higher, what did it do? Both NQ and ES reversed. @jdastra was already nailing a 3R long and I was posting encouraging pa info from what I was seeing on all 3. Very very interesting.

go pull up YM next to your NQ chart right now
this one asset tells you every fake breakout on NQ before it happens
and almost nobody watches it
a trader in my program avoided 11 out of 13 fake breakouts last month by checking one thing on YM before entering on NQ
here's the exact system:
THE YM DIVERGENCE FILTER:
everyone watches NQ and ES. that's it. two charts. side by side. all day
nobody watches YM
that's why they keep getting wicked out
YM is the weakest index. it moves slower. it lags behind NQ and ES. it doesn't have the tech stocks driving momentum
and that's exactly why it's the most honest chart in the market
when NQ and ES are both ripping higher, YM tells you if the move is real or fake
here's how:
REAL MOVE: all three assets are making the same highs at the same time. NQ leads. ES follows. YM confirms. when YM is also making new highs, the move has full institutional commitment. trade it
FAKE MOVE: NQ makes a new high. ES is close. YM isn't even in the same zip code. it's sitting in the middle of the range or barely made it past the previous candle's high. that divergence is institutions telling you they're not committed to this breakout. NQ just grabbed liquidity. it's about to reverse
this is SMT. smart money technique. a crack in correlation between assets that should be moving together
but here's what nobody teaches you about YM specifically:
YM is the FIRST asset to show that
when the market is about to reverse, YM switches from lagging to leading. it goes from the weakest asset to momentarily the strongest. it starts closing candles in the opposite direction while NQ and ES are still pushing
when you see YM close a bearish candle while NQ closes bullish at a key level - that's your strength switch PSP. that's the highest probability reversal signal in the market
i've tracked this across hundreds of trades. when YM confirms the move, win rate is normal. when YM diverges at a key level, the reversal happens within 1-3 candles almost every single time
HOW I USE IT EVERY MORNING:
6:00 AM - i open three charts. NQ. ES. YM. not two. three
6:05 AM - i check the 6AM candle on all three. did they all sweep the same level? did they all close the same direction? if yes, direction is confirmed. if YM didn't follow - i'm watching for the reversal
9:30 AM - price approaches a key level. previous day high, swing point, fair value gap. i check all three assets
both NQ and ES sweep the high but YM doesn't → crack in correlation → the sweep is fake → i'm looking for short entries on the reversal
all three sweep the high → no divergence → i wait. no trade yet. the reversal isn't confirmed
NQ sweeps the high and YM closes bearish on the same candle → strength switch PSP → highest probability entry of the day → enter short on the displacement candle, stop above the sweep, target the next relevant low
9:45 AM - trade is on or there's no setup. either way i'm done looking by 10:30
WHY THIS WORKS:
institutions can fake a breakout on one asset. they can even fake it on two
they can't fake it on three
NQ is the flashy chart. it moves fast. it creates FOMO. retail chases it
ES is the middle child. it usually follows NQ. doesn't tell you much on its own
YM is the lie detector. it's slow. it's boring. nobody watches it. but when it diverges from NQ at a key level, it's telling you exactly what institutions are doing before the move happens
the traders getting wicked out at every breakout are watching two charts
the traders catching every reversal are watching three
EXAMPLES:
NQ takes out the previous day high at 9:37 AM. ES is close behind. you check YM - it's not even near the high. it's sitting in equilibrium of the range. NQ reverses 4 minutes later. you're already short because YM told you it was fake
NQ sweeps a swing low at 10:02 AM. ES sweeps it too. you check YM - it already took that low out 30 minutes ago and reversed. leading asset already hit the draw. lagging assets are catching up. this is asset synchronization. you enter long on NQ targeting the gap above. YM already showed you the reversal was real
the difference between getting wicked out and catching the reversal is one chart you're not looking at
open YM tomorrow morning. put it next to your NQ chart. watch what it does at the first key level of the day
when NQ breaks out and YM doesn't follow - don't take the trade
when YM switches strength at a key level - that's your entry
you'll never trust a two-chart setup again
(free discord in bio. i teach my full framework there, anybody can join)


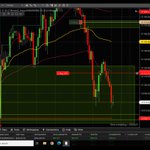
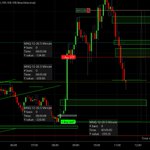
I started trading the 5M chart a few months ago because for me it helps shut out the noise and miss directions. Why did I short the top? 9:45 candle was close enough to completing a 5m gap inverse and the next few candles failed to go higher. Two 5m gaps where created on the initial push down which created a 5m CISD, all I had to do is wait for one of them to get inversed to start building a position, I got in on the 10 pm candle, 1 contract, added 3 on the inverse push up, added 6 on the push down at 10:20, added 6 more by accident lol trimmed down to 4 at the gap created by the 8:40 candle, we kept pushing down so I trimmed down to 1 contract. I’m up $772.00 so far, my stop is $80 in profit so I don’t care what price does from here, I’ll either take profit or keep trailing my stop. No fear no anxiety just calm trade management. Start with 1 contract, manage the trade, don’t be afraid to add aggressively as long as you can peel off the risk quickly or set stop to BE. We got this. 👊🏻🏴☠️
My mindset beginning each trade.
1. Enter using 1 contract, wait to see if idea is working.
2. Get to total of 4 contracts while keeping risk low.
3. Add 3 more and 3 more making a total of 10 contracts with stop at BE or very close. Risk -$100 max.
4. Let trade play out, stop gets hit at BE or if it’s going your way, trim 6 off.
5. Try to hold 4 to target or trim 3 more off holding 1 for a runner.
Move stop in profit asap.
That’s my game plan for every trade, sometimes I go bigger but follow the same plan with trims and stop management.


Boom 💥 Picked up another 4K while listening to T in the live stream. 300k evals are da bomb if you can control yourself and wait for the play, trim quickly to manage your size exposure and then hold a runner or two to help clean up any drawdown issues.


This is a game of nuances, being calm under pressure, patiently waiting for the conditions to present themselves. That 4:15 5m candle is very interesting at the moment. Took a 1 micro starter at 31,003.00, the time of day, the sweep, the gap inversions are all aligning. Can it be? ……hmmmm 🦜🦜🦜🍀🍀🍀🤷🏼♂️🏴☠️Risking $48 to FAFO this one.

Full @greenbirdtrader play in play, took the short around 2.5 std trimmed along the way, 200 points is enough. Hehe.


Adding to winners while maintaining BE with you stop loss, means you have nothing to loose and everything to gain.


Was looking for the @greenbirdtrader play, I think I got a piece of it. Had to trail it and ended up taking profit, still happy with the trade. I’ve got my eyes peeled for this setup now. If I had a static account I would have set stops to BE and let it ride. I’ll get there.

MNQ’s been bull flagging for a few hours, if we sweep the low, maybe time for a long if it fails to go lower on my 5m candles. Test entry around 970ish.
