

Investor 📝 + Trader 📈 + Travel Enjoyer 🗺️ NFA 🙅🏻♀️ + DYOR 📚
Earth ☘️
Joined May 2021
- Tweets102K
- Following998
- Followers19.7K
- Likes453K






Pinned Tweet
$BTC
I don’t rely on other people’s analysis. In July I ran my own Blood 🌖 Moon Cycle analysis, and based on that the bottom for this cycle appears to be in.
We’re already entering the bull market, even if it doesn’t feel that way yet since most altcoins aren’t pumping hard and $ETH still hasn’t made a new ATH.
Things can shift quickly in the coming months, and 2027 is likely to bring much higher prices across the board.
As I’ve said before, we have until mid/late 2028 before conditions start to deteriorate again.


$BTC
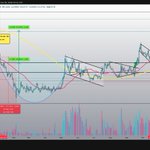
Just updated my Blood Moon 🌘 Cycle Weekly Chart after BTC’s wild run from $62,690 on Aug 17 to $80,500 today, +29% in 8 days.
What My Blood Moon Cycle Model is showing now
-----------------------------------------------------
BTC topped near $126K in Oct 2025, then dropped 54% to $57,735 on July 1, 2026. It’s since climbed back to ~$80K (+40%)
Looking at the last 3 Bitcoin cycles, once price hit the low it never broke below it again for 2+ years. Got close (within ~1%) but held. Only exception was 2020 (COVID)
We’re now 55 days past the $57,735 low, about the same window past cycles needed to leave the bottom behind for good. If this one follows the pattern, a drop back into the $50–57K zone keeps getting less likely every week.
However, it’s only 3 past examples. Pattern, not a proven rule. Nothing is 100%


$ENA l @ethena
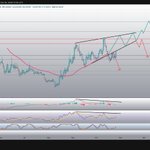
0.175 could mark the bottom of this retest.
Daily RSI and Stoch RSI are turning bullish, while MACD is nearing a bullish crossover. Weekly RSI remains bullish above the 50 level, which is a positive sign.


$CHIP l @USDai_Official
If price gets back inside this pattern, the bullish scenario is back on the table.


$FET l @Fetch_ai
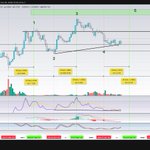
The potential hidden bullish divergence on the monthly chart remains intact.
A bullish MACD crossover is currently developing, while the monthly RSI has already completed its crossover.

ethereum:0xaea46a60368a7bd060eec7df8cba43b7ef41ad85 l @Fetch_ai
Pure's speculation and I'm not a fortuneteller

$FET l @Fetch_ai
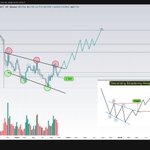
It would be really nice if this descending broadening wedge on the weekly chart plays out as I’ve mapped.
Now, we wait for the reversal + a breakout to confirm the pattern idea.


🧐 $VELO l @veloprotocol

Noticed @veloprotocol updated their website again.
PayFi. Real-World Assets. AI Agents.
One payment super app. 🌎📱💸
Beautiful.
velo:native $USDV


Exactly, that’s what I believe.
The bottom for $BTC was already in around $57K, and I firmly believe we won’t see price drop below $60K again this cycle.
The Blood Moon 🌖 cycle model I’ve been analyzing has accurately marked the bottoms and tops of each cycle so far.

$BTC bottom is in
we bottomed early, didnt get to 44k-50k
57k was bottom, best case scenario played out
55ema weekly reclaim
RSI weekly trendline break + bull div
previous weekly swing high taken out
monthly heikin ashi pattern flipped bullish


🧐 $VELO l @veloprotocol

@veloprotocol + @lightnetgroup are building a new cross-border settlement model for #ASEAN .
Licensed infrastructure + Velo’s FX core + blockchain/stablecoin rails = near real-time payments with institutional compliance.
Backed by UOB. Live with @scb_thailand in Thailand. Powered by @OpenEden_X treasuries.
This is what regulated blockchain settlement looks like.

ethereum:0x51cb253744189f11241becb29bedd3f1b5384fdb l @dimitratech
A potential falling wedge or cup & handle is forming on the daily chart. Both are bullish patterns, so the trend could reverse from 0.0075-0.008 zone.
If either pattern is confirmed, a potential target is around 0.020–0.021


$GRT l @graphprotocol
Price is nearing the green box zone on the chart.
This is a retest after the weekly breakout.
0.022 could mark the bottom of the retest, or it may dip a bit lower to the 0.02–0.021 area in the coming days.
Waiting to see how price develops from here.


