

Bridging the gap between institutions & retail traders since August, 2020. Our tweets are for informational purposes only.
Florida, U.S.
Joined April 2020
- Tweets122K
- Following77
- Followers52.1K
- Likes17.7K






Quant Data retweeted

Putting in tons of work on understanding data and using to find squeeze opportunities
Look at the data from @QuantData
Yesterday, large OTM unusual volume for $VSAT and $AEHR
Today they are both ripping
Definitely something there to catch some huge trades
Gonna keep refining my system


Quant Data retweeted

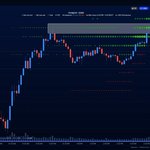
Would love to see a test at the Put Wall at $719 on $QQQ. Sitting right at support now. Expecting chop until volume picks up

Quant Data retweeted
$TSLA has pushed over $400 for the first time since July.
$24M Net Calls so far today, quite a bit of divergence with Net Puts sold as well.


Quant Data retweeted
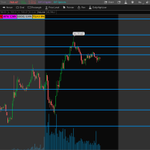
Exposure update for $SPY: Seeing elevated negative exposure under spot, at $765 and $760. If we get a break under $765, could be a potential downside play. Otherwise, I am expecting chop around $765.

Quant Data retweeted
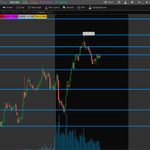
$SPY has been trading around $766 since about 1PM. $766 is the MVC (contract with the great absolute gamma exposure). Seems to have pinned this level into the close.


Quant Data retweeted
$TSLA is up 6% this morning.
Net $21M to the Call-side so far, with Net Puts being sold. Tons of volume flowing in today on it

Quant Data retweeted
Elevated negative Exposure at $755 on $SPY. Directly around spot, there's also some negative exposure building. The Exposure Forecast is expecting some volatility over the next hours or so. I've got resistance at $765 and support at $763.


Quant Data retweeted

I use this.. and lately, it’s all I’ve been using for gamma on Spx
Very accurate
Love the simplicity

Most GEX charts only show a snapshot.
The Interval Map shows how Gamma Exposure evolves throughout the trading session.
Real-time for 6,000+ tickers, including $SPX.
Try our free 7-day trial, then $62.42/mo.
Quant Data retweeted
Straight chop...but Puts still diverging from Calls on $QQQ. Now at a Net $24M divergence with Calls still flat. Interesting to see as we chop around

Quant Data retweeted
29,280 on $NQ_F is the overnight high as well as the MVC (contract with the greatest absolute exposure). Price is floating around this level right now, I am thinking we might retest 29,210 before the next move. We'll see what happens here.

Quant Data retweeted
Quite a bit of negative GEX under spot on $SPY. Downside momentum under $760 could generate a potential short scalp opportunity down to $755. I would be cautious of chop given the volatility we've seen this week.

Quant Data retweeted
$17M Put divergence on $QQQ so far this morning. Net Puts filtered for short-dated, single-leg positions.


Quant Data retweeted
Divergence has widened a bit, Net Put buying has remained constant since my last update, but did see some increased Call selling since then. Still hovering around $35M Puts on $QQQ.

Quant Data retweeted
Apologies for the lack of updates today, had to take care of some things. $QQQ trading between these two significant negative GEX levels at $710 and $700. I think we could hit $700 on the next leg, something to watch out for. Put wall at $704, watch out for potential chop/support.


Quant Data retweeted
GEX update for $SPY. There's quite a bit of negative exposure across the board. Next major level is at $765 on SPY. I am expecting some more volatility this morning as a result of the overnight move.

