

Weather/climate analyzer and forecaster. Info on global weather models, weather patterns, winter, stratosphere, polar vortex, custom graphics, and more...
Slovenia
Joined July 2010
- Tweets3K
- Following217
- Followers2.2K
- Likes2.9K

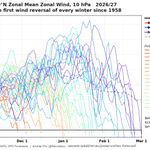

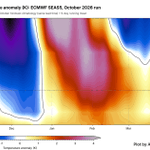


With a lot of talk about the upcoming Polar Vortex disruption and a potentially official SSW (Stratospheric Warming) event, most people cant see what makes this event "unprecedented" as its often called. And for a good reason, as a single map of the #polarvortex can be vague in context. I decided to visualize that context.
The official criteria for an SSW event is the reversal (0 or negative value) of the stratospheric winds at the 10mb level along the 60N polar circle line. We are still on the edge if we will reach a reversal with this event, but there are forecast runs that suggest its likely. Link to those live forecasts is in the comments 👇
Most of the SSW events occur in January and February. I decided to look at every first SSW of each season (some seasons had two) and when it occurred. As you can see, a reversal in the current event would break the record for the earliest SSW on date by at least 3 weeks!
This is really a strong outlier, and having an SSW this early in the season is what makes this event unprecedented in itself, perhaps more so than any temperature or pressure anomaly in the stratosphere.
Its likely not a coincidence we get this with a very strong Super El Niño ongoing in the Pacific. So overall, this is truly a very interesting season for anyone that is into monitoring the weather and seasonal development.

Monitor the Polar Vortex yourself in detail in my live Polar Vortex monitoring hub:
severe-weather.eu/polar-vort…

The roles reverse again, and now ECMWF is back at predicting a Polar Vortex wind reversal and an earliest Stratospheric Warming event on record, while GFS pulls back just above a reversal.
This back-and-forth is likely to go on for a few more runs, since the ensembles are also starting to converge just above the reversal, signaling a very borderline situation.
These live maps are all found in my Polar Vortex hub, link in the comments below. 👇
It is clear that we are going to observe the strongest Polar Vortex disruption in the modern records, and a reversal or not feels more like a technicality at this point. Bottoming out at -1 or 1 is not really a game changer, as its about the event and the drop itself. We can start talking and tracking impacts once the event progress is more or less settled across different models.


Monitor the Polar Vortex yourself in detail in my Polar Vortex hub: severe-weather.eu/polar-vort…
After ECMWF began teasing with a Polar Vortex core split and wind reversal in the stratosphere, the GFS model now caved in and is going into proper Stratospheric Warming with a core split and reversed flow in the mid-stratosphere.
The GFS 3D Polar Vortex forecast really nicely reveals the disruption process of the Polar Vortex and the split of the core area.
All products, inclusing the live 3D #polarvortex forecast arw available in my own Polar Vortex hub, link in the comments. 👇
AIFS remains conservative, which is expected for a model of its type, so we are still in a high-caution mode for now. This also prevents to really discuss potential weather impact, as we first need need to properly resolve which "side" will win in the stratosphere.


Monitor the Polar Vortex yourself in detail in my Polar Vortex hub:
severe-weather.eu/polar-vort…
Polar Vortex update: the 12z suite of models is slowly pulling towards agreement, with the 12z ECMWF now pulling back the reversal and showing good agreement with GFS in terms of #polarvortex strength. Heighy anomaly wise, GFS and AIFS are in good agreement.
But make no mistake, even without a reversal all main 3 models agree on reaching the weakest Polar Vortex on record for this time of year. Tho its still too early in the season and this event, to talk any long-term impacts, especially since a rebound is expected for the Polar Vortex, and the Super El Niño is ramping up for the season.
But overall, this is still a significant event in the making for this time of year.
All the plots (and more) are available in my Polar Vortex monitor hub, link in the comments. 👇


Monitor the Polar Vortex yourself in detail in my Polar Vortex hub: severe-weather.eu/polar-vort…
The 00z ECMWF continues its Stratospheric Warming (SSW) assault on the Polar Vortex, still showing a proper wind reversal, and now it almost reaches a wind reversal down to 50mb.
At the same time, other single model runs are still conservative about a reversal, probably rightfully so, while the GEFS extended run is just in its own world again. The models split around October 29, so in the next few runs or days, we should get a clear picture.
All images are available live and updated in my Polar Vortex hub, link in the comments below 👇


Monitor the Polar Vortex yourself in detail in my Polar Vortex hub: severe-weather.eu/polar-vort…
Wow! Latest ECMWF 12z is going all out in the stratosphere, now forecasting an actual Stratospheric Warming event with a wind reversal, making it an official SSW event.
It will likely not remain at this, as this would be an unprecedented event, and the model trend map shows quite a spread between the last runs. But even seeing this suggested at this time is really insane.
All the maps are available in my Polar Vortex hub (link in the comments)
@judah47
I have seen you noticed the 12z ECM, but did you know it also has a proper reversal? 😁


You can also monitor this ongoing development yourself in the Polar Vortex hub: severe-weather.eu/polar-vort…
How accurate are Polar Vortex forecasts really? I created new graphics that will answer this question over the whole 2026/2027 season, with the first real test coming in the coming days.
The graphics are already live in my Polar Vortex hub, under the "Forecast Accuracy" tab, and update twice per day.
severe-weather.eu/polar-vort…
Every line on the charts is one forecast a model made, and the black line is what actually happened. When the forecast lines keep landing above or below the analysis line, you can see whether a model tends to forecast the #polarvortex too strong or too weak.
I am monitoring the ECMWF, GFS, and AIFS, plus their ensembles. You can view the last 30 days, or the full season from late September to April, which fills in as the season goes on.
The first real test is starting right now: the models show the Polar Vortex weakening sharply into early November, with a general trend towards weaker Polar Vortex coming from ECMWF


I decided to already do some upgrades on my Polar Vortex monitor/forecast page (link below), so I added 4 new visual products and a status bar which tells right away in what state the #polarvortex is.
The 4 new products are a heat flux map, an ensemble SSW probability map, an SSW analog years map, and what I am most proud of, a 3D Polar Vortex forecast animation from live GFS data, updating every run.
I am really grateful that I got very good feedback on my Polar Vortex monitor/forecast page today, so thanks to everyone that tried it out and finds the products useful!
Here is the direct link to the page for anyone that want to try it out: severe-weather.eu/polar-vort…


Not sure how X handles these links, as I am not otherwise a regular user here, so I got suggestions to rather post the link in the comments: severe-weather.eu/polar-vort…
Looking at the latest SAI forecast, October is aiming to end on a high note.
Combining observations and forecast, the final October SAI is heading for around +1.2 sigma. This is well above-normal snow advance, with only a handful of Octobers advancing faster in the last 27 years (2009, 2012, 2014, 2015, 2016).
A strong SAI is one ingredient for a weaker #polarvortex in winter, though the link has been less reliable in recent years. But with the Polar Vortex now having some unusual struggles, a Super El Niño on the rise, and now SAI, we are really in a period that gets you excited if you are a seasonal weather observer! 🙏
@judah47
