

Samco Securities Limited SEBI Reg. No. INZ000002535 Don’t just trade blindly, Trade Scientifically Only on Samco Trading App 👇 https://nitter.gq/t.co/9heAyuTgMD
India
Joined January 2015
- Tweets15.9K
- Following7
- Followers10.5K
- Likes966




💊 Indian Pharma’s Innovation Scorecard: Who’s Investing More in R&D?
R&D remains a key differentiator as Indian pharma companies strengthen innovation, expand complex generics and build pipelines in specialty medicines, biologics and novel therapies.
📊 Q2 FY27 data reveals significant differences in R&D spending across leading players.
Higher R&D investment signals a stronger focus on differentiated products and future growth. However, returns ultimately depend on clinical outcomes, regulatory approvals and successful commercialisation.
Follow SAMCO for more market insights! 👉 tinyurl.com/3ja9cv6s
#IndianPharma #PharmaIndustry #RnD #Pharmaceuticals #SamcoWealth

1
245
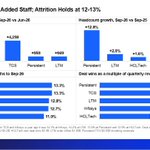
📊 IT hiring picks up, but is it the start of a new hiring cycle?
TCS, Infosys, HCLTech, LTM & Persistent added 17,095 employees in Q2 FY27, taking combined headcount to ~12.8 lakh.
🔹 HCLTech led with 6,450 additions, followed by Infosys (4,480) and TCS (4,258).
🔹 Persistent recorded the highest YoY headcount growth at 12.9%.
🔹 Attrition remained range-bound at 11.9%–13.3%.
🔹 Deal wins ranged from 0.87x at HCLTech to 1.30x at Persistent.
While attrition remains stable, sustained hiring will depend on how effectively these deal wins translate into revenue.
Follow SAMCO for more market insights! 👉 tinyurl.com/3ja9cv6s
#ITSector #IndianIT #Q2FY27 #EarningsSeason #StockMarket #SAMCO

275
Gold is losing its shine, but falling crude oil prices could bring some relief to India. 👀
Not every market fall tells the same story!
While gold and silver face selling pressure amid changing US interest rate expectations, falling crude oil prices could offer a different opportunity for an oil-importing economy like India. 📉
But what's connecting these seemingly different market movements? And why is the US Federal Reserve playing such an important role in this story?
One global development, two very different impacts. 🌍
Watch the video to understand what's changing in global markets and what it could mean for India and your portfolio.
#GoldPrice #SilverPrice #CrudeOil #FederalReserve #IndianEconomy #GlobalMarkets #SAMCOWealth
367
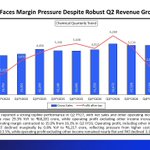
🧪 Chemical Sector: Strong Revenue Growth, But Margins Under Pressure!
India's chemical sector delivered robust topline growth in Q2FY27, but rising costs continued to weigh on profitability.
📈 Key Q2FY27 highlights (YoY):
🔹 Net Sales: Up 29.5% to ₹80,360 crore
🔹 Expenditure: Up 29.3% to ₹68,281 crore
🔹 Operating Profit (excluding other income): Up 8.3% to ₹12,078 crore
🔹 Core Operating Margin: Down to 15.0% from 16.1%
🔹 Operating Profit (including other income): Up 5.2% to ₹12,987 crore
🔹 PAT: Down 0.8% to ₹6,217 crore
📉 Sequentially (QoQ):
Revenue grew 13.5%, while operating profit (excluding other income) remained nearly flat and PAT declined 3.1%.
The takeaway: Revenue growth remains strong, but higher costs, interest and depreciation are putting pressure on margins and bottom-line profitability.
Can the chemical sector turn revenue momentum into stronger earnings growth? 👀
Follow SAMCO for more market insights! 👉 tinyurl.com/3ja9cv6s
#ChemicalSector #Q2FY27 #IndianMarkets #EarningsSeason #QuarterlyResults #Profitability #StockMarket #SAMCO

269
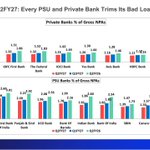
🏦 Clean Sweep in Q2FY27: Banks Continue to Reduce Bad Loans!
Every bank across the Nifty PSU Bank and Nifty Private Bank indices reported lower Gross NPAs, both QoQ and YoY. 📉
The biggest improvements came from banks that previously had higher bad-loan ratios:
🔹 Bandhan Bank: 5.02% → 3.11%
🔹 Canara Bank: 2.35% → 1.33%
🔹 Indian Bank: 2.60% → 1.61%
🔹 RBL Bank: 2.32% → 1.02%
RBL Bank has more than halved its Gross NPA ratio, giving it the lowest among private banks.
Another surprise? Indian Overseas Bank's Gross NPA ratio stands at 1.19%, lower than ICICI Bank's 1.23%.
📊 The bigger picture:
• Private Banks: Average Gross NPAs fell from 2.20% to 1.52%.
• PSU Banks: Average Gross NPAs fell from 2.51% to 1.80%.
Lower bad loans mean fewer provisions, potentially higher profits and more capital available for lending.
But with asset quality improving across the board, the next growth drivers will be loan growth and margins.
Clean books are in place. Can growth follow? 👀
Follow SAMCO for more market insights! 👉 tinyurl.com/3ja9cv6s
#BankingSector #IndianBanks #PSUBanks #PrivateBanks #GrossNPA #Q2FY27 #BankingStocks #StockMarket #SAMCO

391
Every GTA player knows that progress takes patience and persistence. 🎮
The stock market isn't very different. Building wealth is a journey, not a quick mission.
Play the long game. 📈
#GTA6 #Nifty50 #StockMarket #GTAVI #WealthCreation #SAMCOWealth #Longterm #GTA #ViceCity

305
Behind every responsibility is a man who keeps showing up, facing challenges and moving forward, even when the journey gets tough.
This Men's Day, here's to their strength, resilience and the courage to never give up. 💙
Happy Men's Day!
#MensDay #InternationalMensDay #MensDay2026 #Strength #Resilience #SAMCOWealth

308
Large Cap, Mid Cap, Small Cap: Who Defined These Categories? 🤔
It was SEBI that brought structure to India’s mutual fund landscape in 2018 by introducing standardised categories for mutual fund schemes.
The move brought greater consistency and transparency, helping investors better understand where their money is being invested.
Because informed investing starts with knowing what you’re investing in.
#MutualFunds #SEBI #LargeCap #MidCap #SmallCap #Investing #SAMCOWealth
285
🚨New IPO Alert
Mahanadi Coalfields IPO opens on 19th November 2026! ⛏️
👉 Mahanadi Coalfields is India’s largest single coal-producing company, contributing 21% of India’s domestic coal production in FY26, with an annual production of 218.31 million tonnes.
👉 The company operates 17 mines across Odisha and holds coal reserves of 9,840.31 million tonnes, enough to support around 45 years of production at current levels.
To know more, click 👉 tinyurl.com/5xz28446
#MahanadiCoalfields #MahanadiCoalfieldsIPO #IPOAlert #UpcomingIPO #IPO2026 #IndianIPO #CoalIndia #StockMarket #ShareMarket #IPOInvesting #SAMCOWealth

314
📈 Strong Sales, Weak Margins: FMCG Faces a Profitability Challenge!
India’s FMCG sector delivered strong topline growth in Q2 FY27, but rising costs weighed on profitability.
📊 Key Highlights:
• Net sales grew 21.5% YoY to ₹1,16,876 Cr.
• Expenditure increased 25% YoY, outpacing revenue growth.
• Operating margin contracted to 24.5% from 26.3%.
• PAT declined 1.1% YoY to ₹13,298 Cr.
• PAT margin eased to 16.8% from 18.6%.
📉 Sequentially, operating profit and PAT declined 3.2% and 3.9%, respectively, despite largely stable revenue.
The takeaway: Strong sales growth isn't translating into stronger earnings as rising cost pressures continue to weigh on profitability.
Follow SAMCO for more market insights! 👉 tinyurl.com/3ja9cv6s
#FMCG #Q2FY27 #EarningsUpdate #IndianMarkets #StockMarket #CorporateEarnings #Profitability #SAMCO

1
1
311
📊 Q2 FY27: Zomato & Blinkit Outgrow Swiggy & Instamart!
Eternal outpaced Swiggy across key operating metrics:
🍔 Food Delivery
• Zomato NOV grew 21.5% YoY to ₹11,445 Cr vs Swiggy GOV growth of 17.7% to ₹10,054 Cr.
• Adjusted revenue grew 35.5% for Zomato vs 18.7% for Swiggy.
• Zomato's adjusted EBITDA stood at ₹627 Cr, 1.8x Swiggy's ₹341 Cr.
⚡ Quick Commerce
• Blinkit’s dark stores surged 51.5% YoY to 2,751 vs Instamart's 12.5% growth to 1,240.
• Monthly transacting users grew 77.9% for Blinkit vs 23.3% for Instamart.
• Blinkit NOV reached ₹20,940 Cr, around 3.2x Instamart's ₹6,594 Cr.
💰 Bottom Line
Eternal reported ₹666 Cr adjusted EBITDA and ₹125 Cr PAT, while Swiggy posted a ₹760 Cr adjusted EBITDA loss and ₹922 Cr net loss.
The growth gap is becoming increasingly evident in quick commerce.
Follow SAMCO for more market insights! 👉 tinyurl.com/3ja9cv6s
#Q2FY27 #Zomato #Blinkit #Swiggy #Instamart #Eternal #QuickCommerce #FoodDelivery #EarningsUpdate #StockMarket

308
Your financial priorities don’t remain the same forever, so why should your money habits?
At 25, it’s about laying the foundation. At 35, it’s about balancing growth with responsibilities. By 45 and 55, the focus shifts towards securing your future and making your wealth last.
Every decade brings a new financial milestone, and the choices you make along the way matter.
#FinancialPlanning #MoneyHabits #WealthCreation #PersonalFinance #MoneyManagement #FuturePlanning #Samco #SamcoWealth #ShareMarket #StockMarketIndia


249
What if today's little dreams become tomorrow's biggest achievements?
Every child deserves the freedom to dream big and the support to make those dreams possible.
Because a brighter tomorrow begins with the choices we make today.
Happy Children's Day! 🌱
#ChildrensDay #FutureStartsToday #SAMCOWealth

1
300
⚡ Hitachi Energy Q2FY27: Revenue Surges 64%, Stock Jumps 12%!
📈 Revenue grew 63.5% YoY to ₹2,996.5 Cr, while Operational EBITDA rose 69.5% to ₹494.4 Cr, with margins improving to 16.5%.
However, PAT growth remained modest at 20.5% YoY to ₹318.5 Cr as higher material costs, forex losses and lower other income weighed on profitability.
🔍 Key highlights:
• Order inflows up 85.9% YoY to ₹4,120.8 Cr
• Order backlog at ₹33,335.4 Cr
• Material costs increased to 61.7% of revenue
• Forex & commodity loss stood at ₹56.1 Cr
🚀 Strong order visibility and demand from grid expansion, renewables and data centres support the growth outlook. Margin sustainability remains key to watch.
Follow SAMCO for more market insights! 👉 tinyurl.com/3ja9cv6s
#HitachiEnergy #Q2FY27Results #StockMarketIndia #EarningsUpdate #IndianStockMarket #NSE #BSE

🌍 When global markets feel the pressure, where does India stand?
With changing global cues and shifting investor sentiment, the bigger question is whether India’s market momentum can hold its ground.
Is this resilience here to stay, or is the real test still ahead?
Watch the video to understand the bigger picture.
#USFed #IndianStockMarket #Nifty #StockMarket #GlobalMarkets #MarketAnalysis #SAMCOWealth #Shorts #interestrates #FedRateHike
283
Ever noticed 3 curvy lines on a stock chart? 🤔
Those 3 lines you see around a stock’s price are called Bollinger Bands. Sounds technical, but the idea is simple: they don’t tell you if a stock will go up or down; they tell you how volatile it is.
Wide bands = high volatility
Narrow bands = low volatility
Watch the video to understand.
#BollingerBands #StockMarket #StockMarketForBeginners #TechnicalAnalysis #Volatility #ShareMarket #StockMarketIndia #StockCharts #LearnTrading #SamcoWealth
245
⚡ Tata Power Delivers Strong Revenue & PAT Growth in Q2 FY27!
📈 Revenue from Operations surged 26% YoY to ₹19,636 crore.
💰 PAT jumped 33% YoY to ₹1,652 crore, reflecting strong earnings growth.
However, EBITDA declined 5% QoQ to ₹3,667 crore, while EBITDA margin moderated to 18.7% from 20.3% in the previous quarter.
🔍 Strong growth, but sustaining margins remains key to future earnings momentum.
Follow SAMCO for more market insights! 👉 tinyurl.com/3ja9cv6s
#TataPower #Q2FY27 #QuarterlyResults #EarningsUpdate #StockMarket #IndianStockMarket #SAMCO

284
Hindustan Copper Q2FY27: PAT Soars 182% YoY, EBITDA Margin Touches 60%! 📈
Hindustan Copper delivered a strong Q2FY27 performance:
🔹 Revenue: ₹1,175.2 Cr, up 63.7% YoY
🔹 EBITDA: ₹702.8 Cr, up 149.1% YoY
🔹 Net Profit: ₹518.1 Cr, up 181.9% YoY
🔹 EBITDA Margin: Expanded to 59.8% from 39.3% a year ago.
Operating cash flow doubled to ₹843 Cr in H1, while the company repaid its entire ₹110 Cr debt.
However, rising royalty and cess costs, higher receivables and the need to accelerate capex remain key monitorables.
Follow SAMCO for more market insights! 👉 tinyurl.com/3ja9cv6s
#HindustanCopper #Q2FY27 #QuarterlyResults #EarningsUpdate #Copper #MiningSector #StockMarket #IndianStockMarket #SAMCO

297
📈 Rentomojo Q2FY27: Revenue Up 53%; Rental Subscribers Jump 43%
Rentomojo delivered a strong Q2FY27, its first quarter as a listed company.
Key Highlights:
🔹 Revenue from Operations: ₹142.1 Cr, up 52.8% YoY
🔹 Normalised EBITDA: ₹58.8 Cr, up 52.7% YoY
🔹 Normalised PAT: ₹24 Cr, up 52.2% YoY
🔹 Live Subscribers: 3.24 lakh, up 42.5% YoY
🔹 Live Items: 10.49 lakh, up 44% YoY
🔹 Gross Items Ordered: 3.81 lakh, up 45% YoY
🔹 Average Occupancy: 85.9%, up 61 bps YoY
Profitability remains strong: Normalised EBITDA margin stood at 40.9%, while normalised ROCE came in at 25.3%.
Reported PAT declined 62.6% YoY to ₹18.2 Cr, primarily due to a ₹32.8 Cr deferred tax credit in the year-ago quarter.
Meanwhile, H1 operating cash flow stood at ₹110 Cr, with net debt declining to ₹131 Cr post-IPO.
Key monitorables: Occupancy as the fleet scales, ARPI trends and returns on IPO-funded expansion.
📊 At ₹591 (9 Nov 2026), the stock trades at approximately 68x annualised H1FY27 normalised PAT.
Follow SAMCO for more market insights! 👉 tinyurl.com/3ja9cv6s
#Rentomojo #Q2FY27 #EarningsUpdate #QuarterlyResults #StockMarket #IndianEquities #SAMSHOTS

1
463
📊 Equity Mutual Funds Continue to See Positive Inflows Despite Moderation in October!
Despite a month-on-month decline in AAUM across all five categories, equity mutual funds continued to attract investor money.
🔹 Flexi-cap: Highest AAUM at ₹5,88,815 Cr | Inflows of ₹4,980 Cr
🔹 Mid-cap: AAUM of ₹5,09,272 Cr | Inflows of ₹4,893 Cr
🔹 Small-cap: AAUM of ₹4,52,932 Cr | Highest inflows of ₹6,407 Cr
🔹 Thematic: AAUM of ₹3,93,244 Cr | Inflows of ₹1,162 Cr
🔹 Large-cap: AAUM of ₹3,90,419 Cr | Inflows of ₹1,032 Cr
💡 The numbers reflect continued investor interest in equity schemes, even as inflows moderated.
Follow SAMCO for more market insights! 👉 tinyurl.com/3ja9cv6s
#MutualFunds #EquityMutualFunds #AMFI #MutualFundInvestments #SmallCapFunds #FlexiCapFunds #MidCapFunds #IndianStockMarket #InvestmentTrends #SAMCOWealth

292